

Question: Below is my OM Solver, please look it over. I'm not sure its right. The problem is below. The Kool King Company has followed a
Below is my OM Solver, please look it over. I'm not sure its right. The problem is below.
The Kool King Company has followed a policy of no layoffs for most of the manufacturer's life, even though the demand for its air conditioners is highly seasonal. Management wants to evaluate the cost effectiveness of this policy. Competitive pressures are increasing, and ways need to be found to reduce costs. The following demand (expressed in employee-month equivalents) has been forecast for next year:
Additional planning data follow, with costs, inventory, and backorders expressed in employee-month equivalents: Hiring costs are lower than layoff costs because the facility is located near a technical training school. Undertime is paid at the rate equivalent to regular-time production. Each employee who has been with the company at least 1 year also received 0.5 month of paid vacation. All 130 employees currently employed qualify for vacations next year, assuming that they remain on the workforce.
Develop an S&OP with the level strategy using overtime, undertime, and vacations as the only supply options. Use the maximum amount of overtime so as to minimize undertime. What is the total cost of this plan, and what are its advantages and disadvantages?
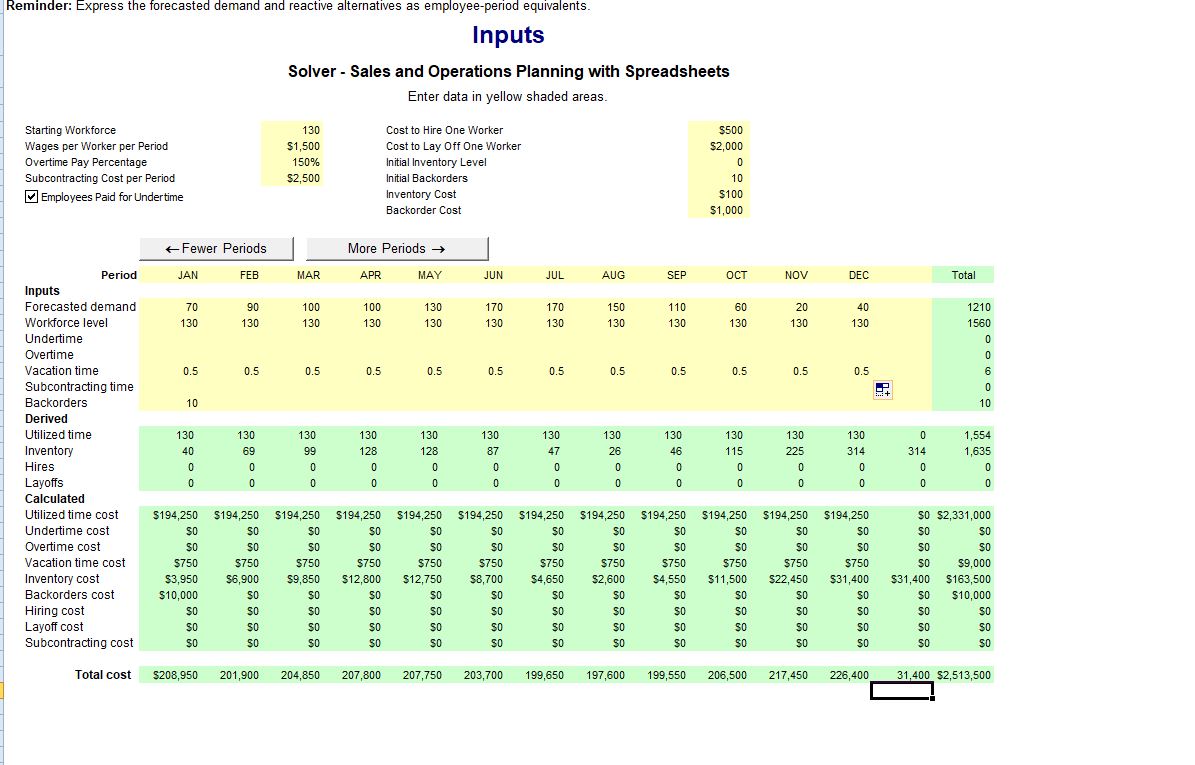
Reminder: Express the forecasted demand and reactive alternatives as employee-period equivalents. Inputs Solver - Sales and Operations Planning with Spreadsheets Enter data in yellow shaded areas. Starting Workforce 130 Cost to Hire One Worker $500 Wages per Worker per Period $1,500 Cost to Lay Off One Worker $2,000 Overtime Pay Percentage 150% Initial Inventory Level $2,500 Initial Backorders 10 Subcontracting Cost per Period $100 Employees Paid for Under time Inventory Cost Backorder Cost $1,000 + Fewer Periods More Periods - APR MAY JUN JUL AUG SEP OCT NOV DEC Total Period JAN FEB MAR Inputs Forecasted demand 70 90 100 100 130 170 170 150 110 60 20 40 1210 130 130 130 1560 Workforce level 130 130 130 130 130 130 130 130 30 0 Undertime 0 Overtime 6 Vacation time 0.5 0.5 0.5 7.5 0.5 0.5 0.5 0.5 0.5 0.5 Subcontracting time 10 Backorders 10 Derived Utilized time 130 130 130 130 130 130 130 130 130 130 130 130 1,554 128 87 47 26 46 115 225 314 314 1,635 Inventory 40 69 99 128 0 Hires 0 0 0 0 0 0 0 0 0 0 0 0 0 Layoffs Calculated Utilized time cost $194,250 $194,250 $194,250 $194,250 $194,250 $194,250 $194,250 $194,250 $194,250 $194,250 $194,250 $194,250 50 $2,331,000 SO 50 SO 50 S Undertime cost 50 30 SO SO SO So SO Overtime cost so SO SO SO SO Vacation time cost $750 $750 $750 $750 $750 $750 $750 $750 $750 $750 $750 $750 SO $9,000 Inventory cost $3,950 $6,900 59,850 $12,800 $12,750 $8,700 $4,650 $2,600 $4.550 $11,500 $22,450 $31,400 $31,400 $163,500 $10,000 Backorders cost $10,000 SO SO SO SO SO SO SO SO SO 50 SO SO 50 Hiring cost SO SO 50 SO 50 SO Layoff cost SO SO SO SO SO SO SO Subcontracting cost 50 SO 50 SO SO SO so SO SO Total cost $208,950 201,900 204,850 207,800 207,750 203,700 199,650 197,600 199,550 206,500 217,450 226,400 31,400 $2,513,500
Step by Step Solution
There are 3 Steps involved in it

Get step-by-step solutions from verified subject matter experts