

Question: - Below is selected balance sheet and income statement information from Hudson & Company. (in millions) Cash Accounts receivable Current assets Current liabilities Long-term debt
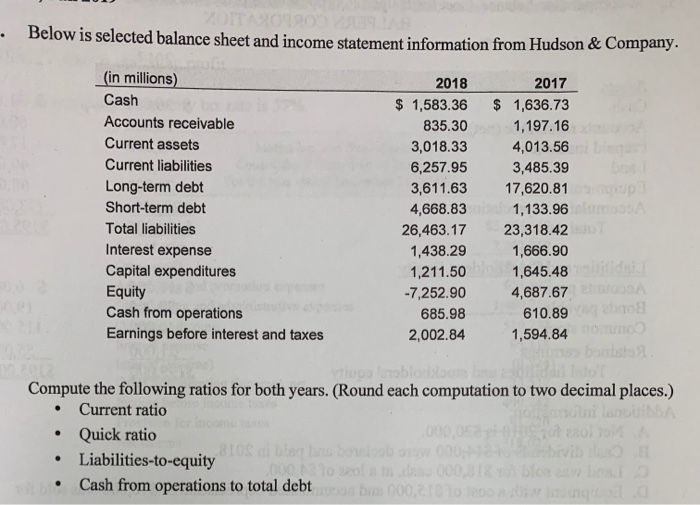
- Below is selected balance sheet and income statement information from Hudson & Company. (in millions) Cash Accounts receivable Current assets Current liabilities Long-term debt Short-term debt Total liabilities Interest expense Capital expenditures Equity Cash from operations Earnings before interest and taxes 2018 $ 1,583.36 835.30 3,018.33 6,257.95 3,611.63 4,668.83 26,463.17 1,438.29 1,211.50 -7,252.90 685.98 2,002.84 2017 $ 1,636.73 1.197.16 4,013.56 3,485.39 17,620.81 1,133.96 23,318.42 1,666.90 1,645.48 4,687.67 610.89 1,594.84 100 Compute the following ratios for both years. (Round each computation to two decimal places.) Current ratio Quick ratio Liabilities-to-equity Cash from operations to total debt bu000 2
Step by Step Solution
There are 3 Steps involved in it

Get step-by-step solutions from verified subject matter experts