

Question: Below is some data on the relationship between the price of a certain manufacturer's flat panel LCD televisions and the area of the screen. Scatteplot
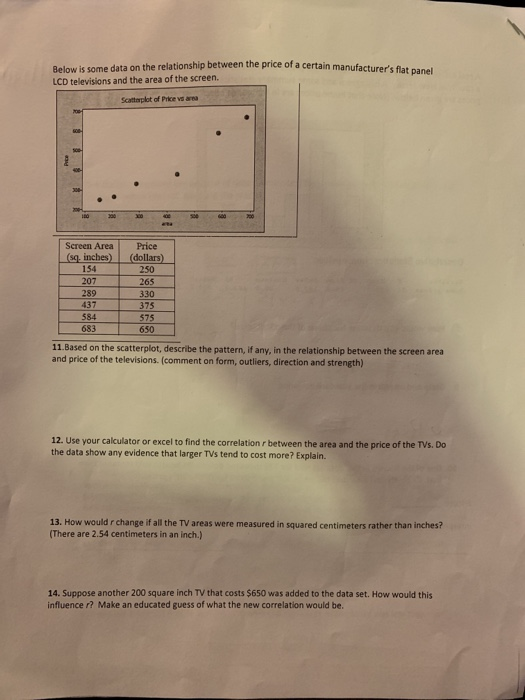
Below is some data on the relationship between the price of a certain manufacturer's flat panel LCD televisions and the area of the screen. Scatteplot of Price va area Screen Area Price (sq inches)dollars) 154 207 289 437 250 265 330 375 575 650 683 11.Based on the scatterplot, describe the pattern, if any, in the relationship between the screen area and price of the televisions. (comment on form, outiliers, direction and strength) 12. Use your calculator or excel to find the correlation r between the area and the price of the TVs. Do the data show any evidence that larger TVs tend to cost more? Explain. 13. How would r change if all the TV areas were measured in squared centimeters rather than inches? (There are 2.54 centimeters in an inch.) 14. Suppose another 200 square inch TV that costs $650 was added to the data set. How would this influence r? Make an educated guess of what the new correlation would be
Step by Step Solution
There are 3 Steps involved in it

Get step-by-step solutions from verified subject matter experts