

Question: Below is the data on maximum daily rainfall in South Bend, Indiana over a 30-year period: 1.88 2.23 2.58 2.07 2.94 2.29 3.14 2.15 1.95
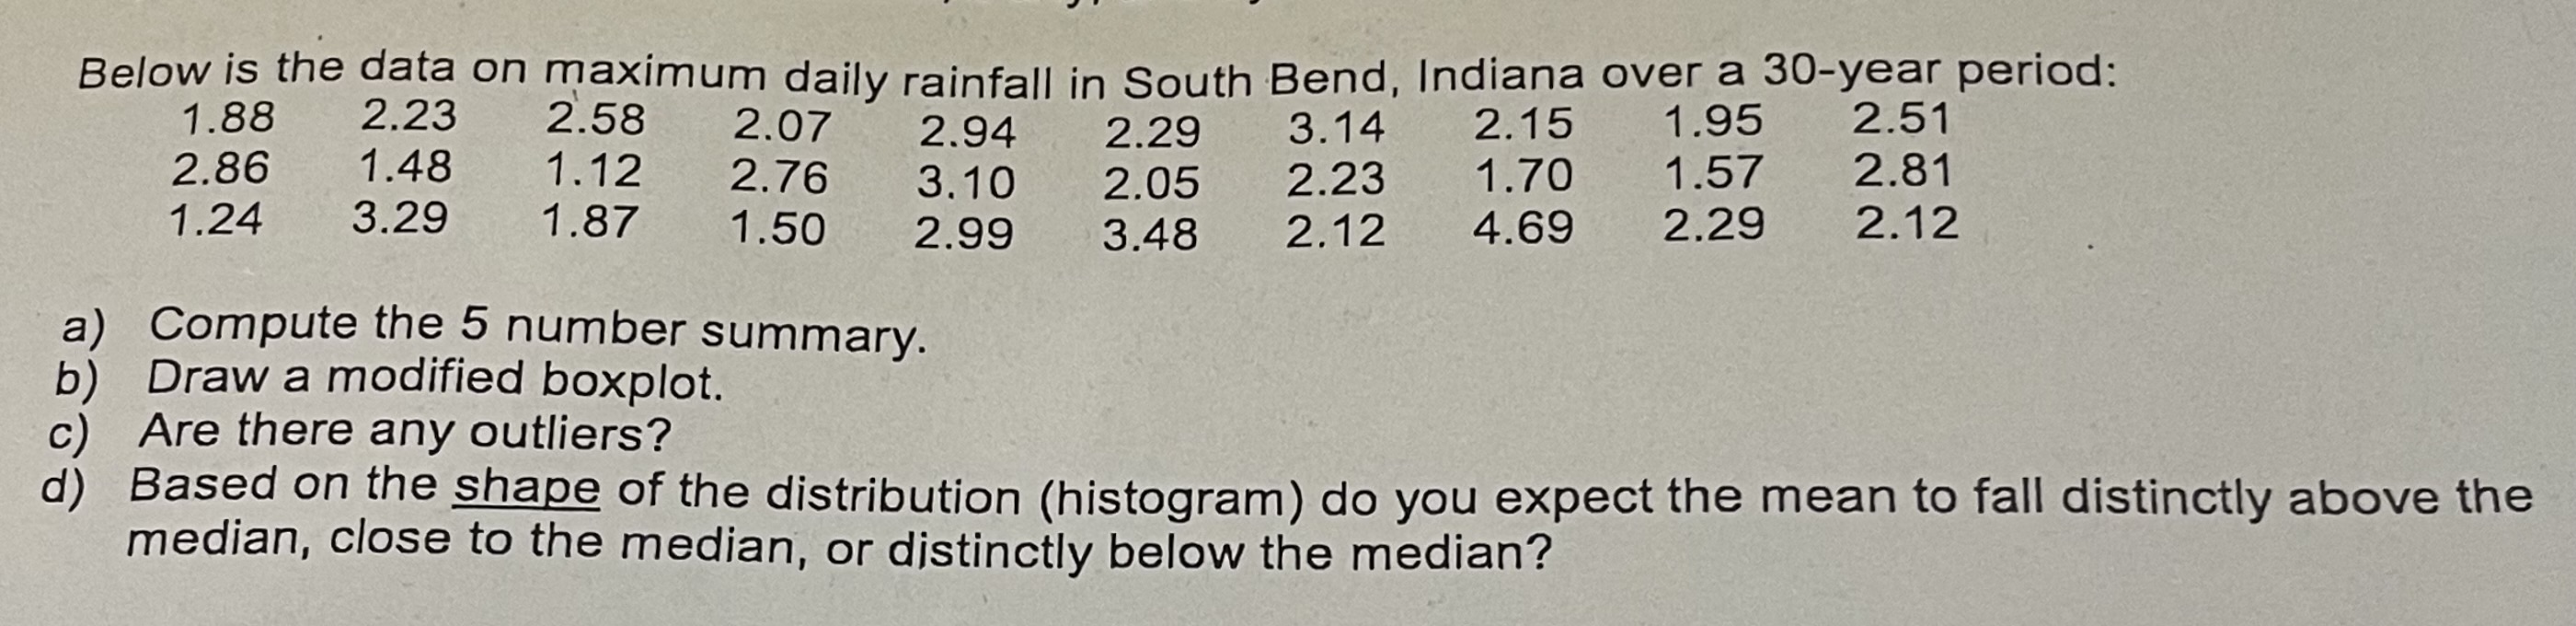
Below is the data on maximum daily rainfall in South Bend, Indiana over a 30-year period: 1.88 2.23 2.58 2.07 2.94 2.29 3.14 2.15 1.95 2.51 2.86 1.48 1.12 2.76 3.10 2.05 2.23 1.70 1.57 2.81 1.24 3.29 1.87 1.50 2.99 3.48 2.12 4.69 2.29 2.12 Compute the 5 number summary. b) Draw a modified boxplot. C) Are there any outliers? Based on the shape of the distribution (histogram) do you expect the mean to fall distinctly above the median, close to the median, or distinctly below the median
Step by Step Solution
There are 3 Steps involved in it
1 Expert Approved Answer
Step: 1 Unlock

Question Has Been Solved by an Expert!
Get step-by-step solutions from verified subject matter experts
Step: 2 Unlock
Step: 3 Unlock