

Question: Below is the graph of a polynomial function with real coefficients. All local extrema of the function are shown in the graph. Use the graph


Below is the graph of a polynomial function with real coefficients. All local extrema of the function are shown in the graph. Use the graph to answer the following questions.
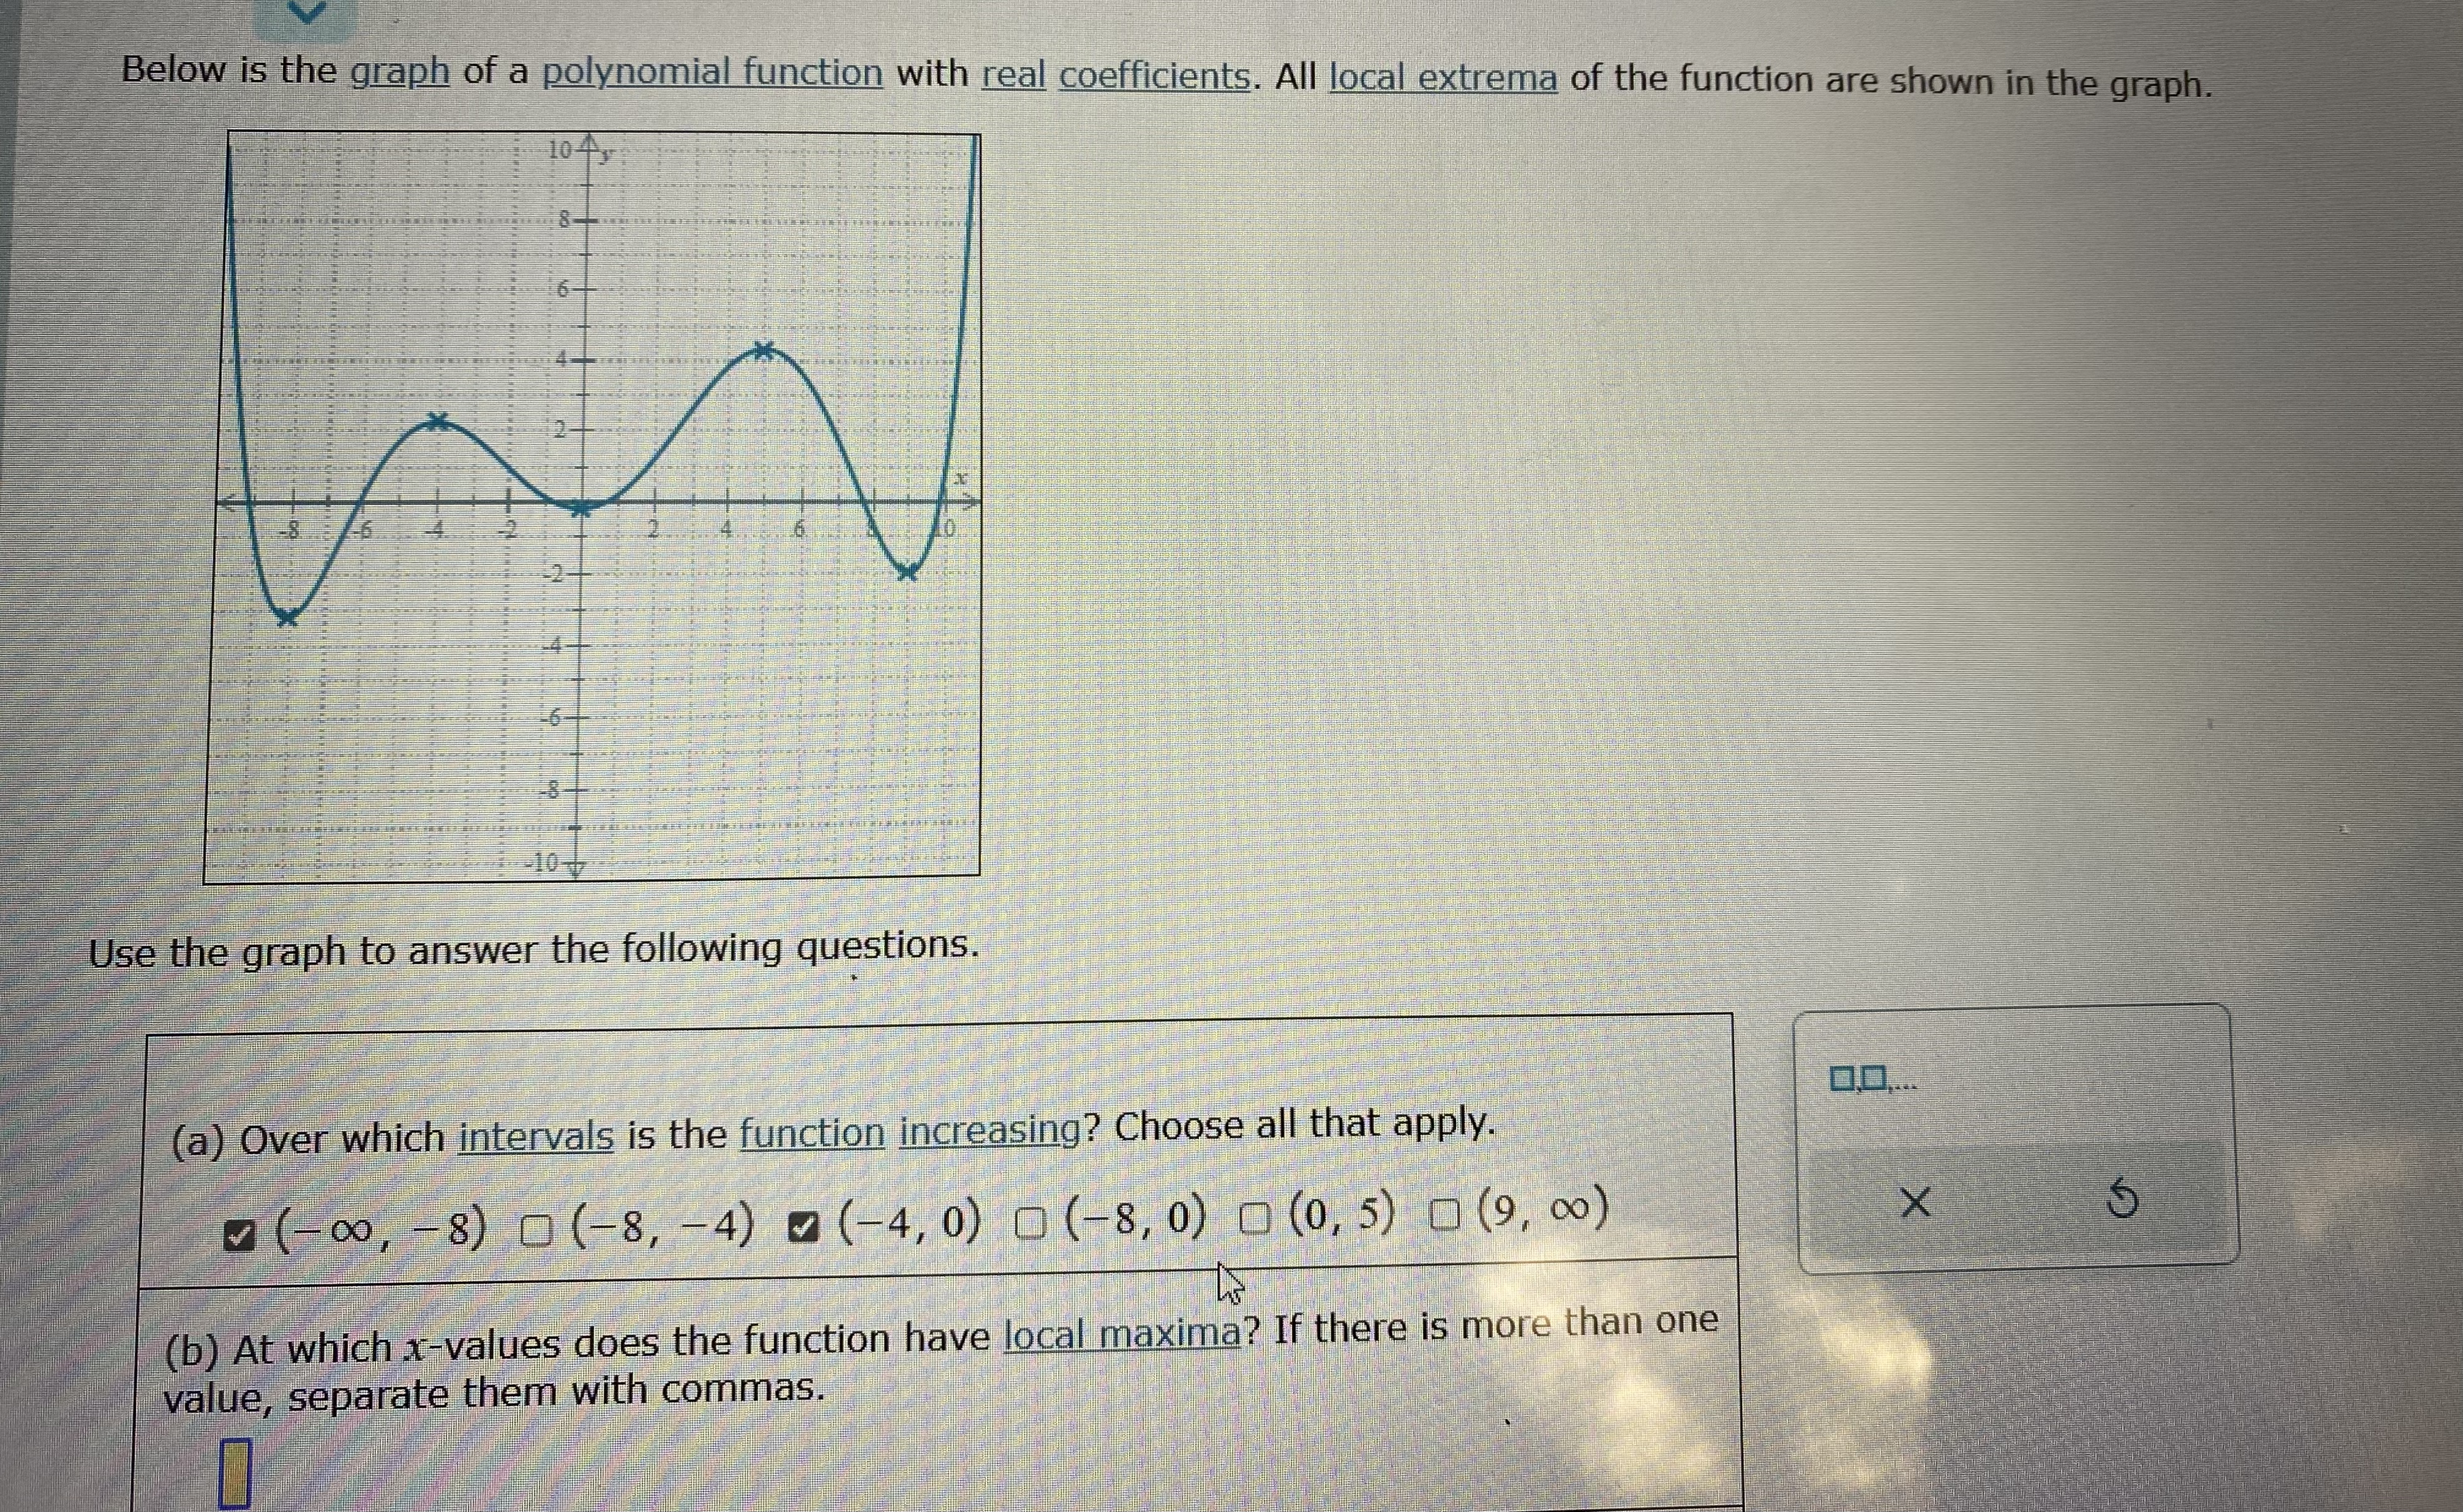

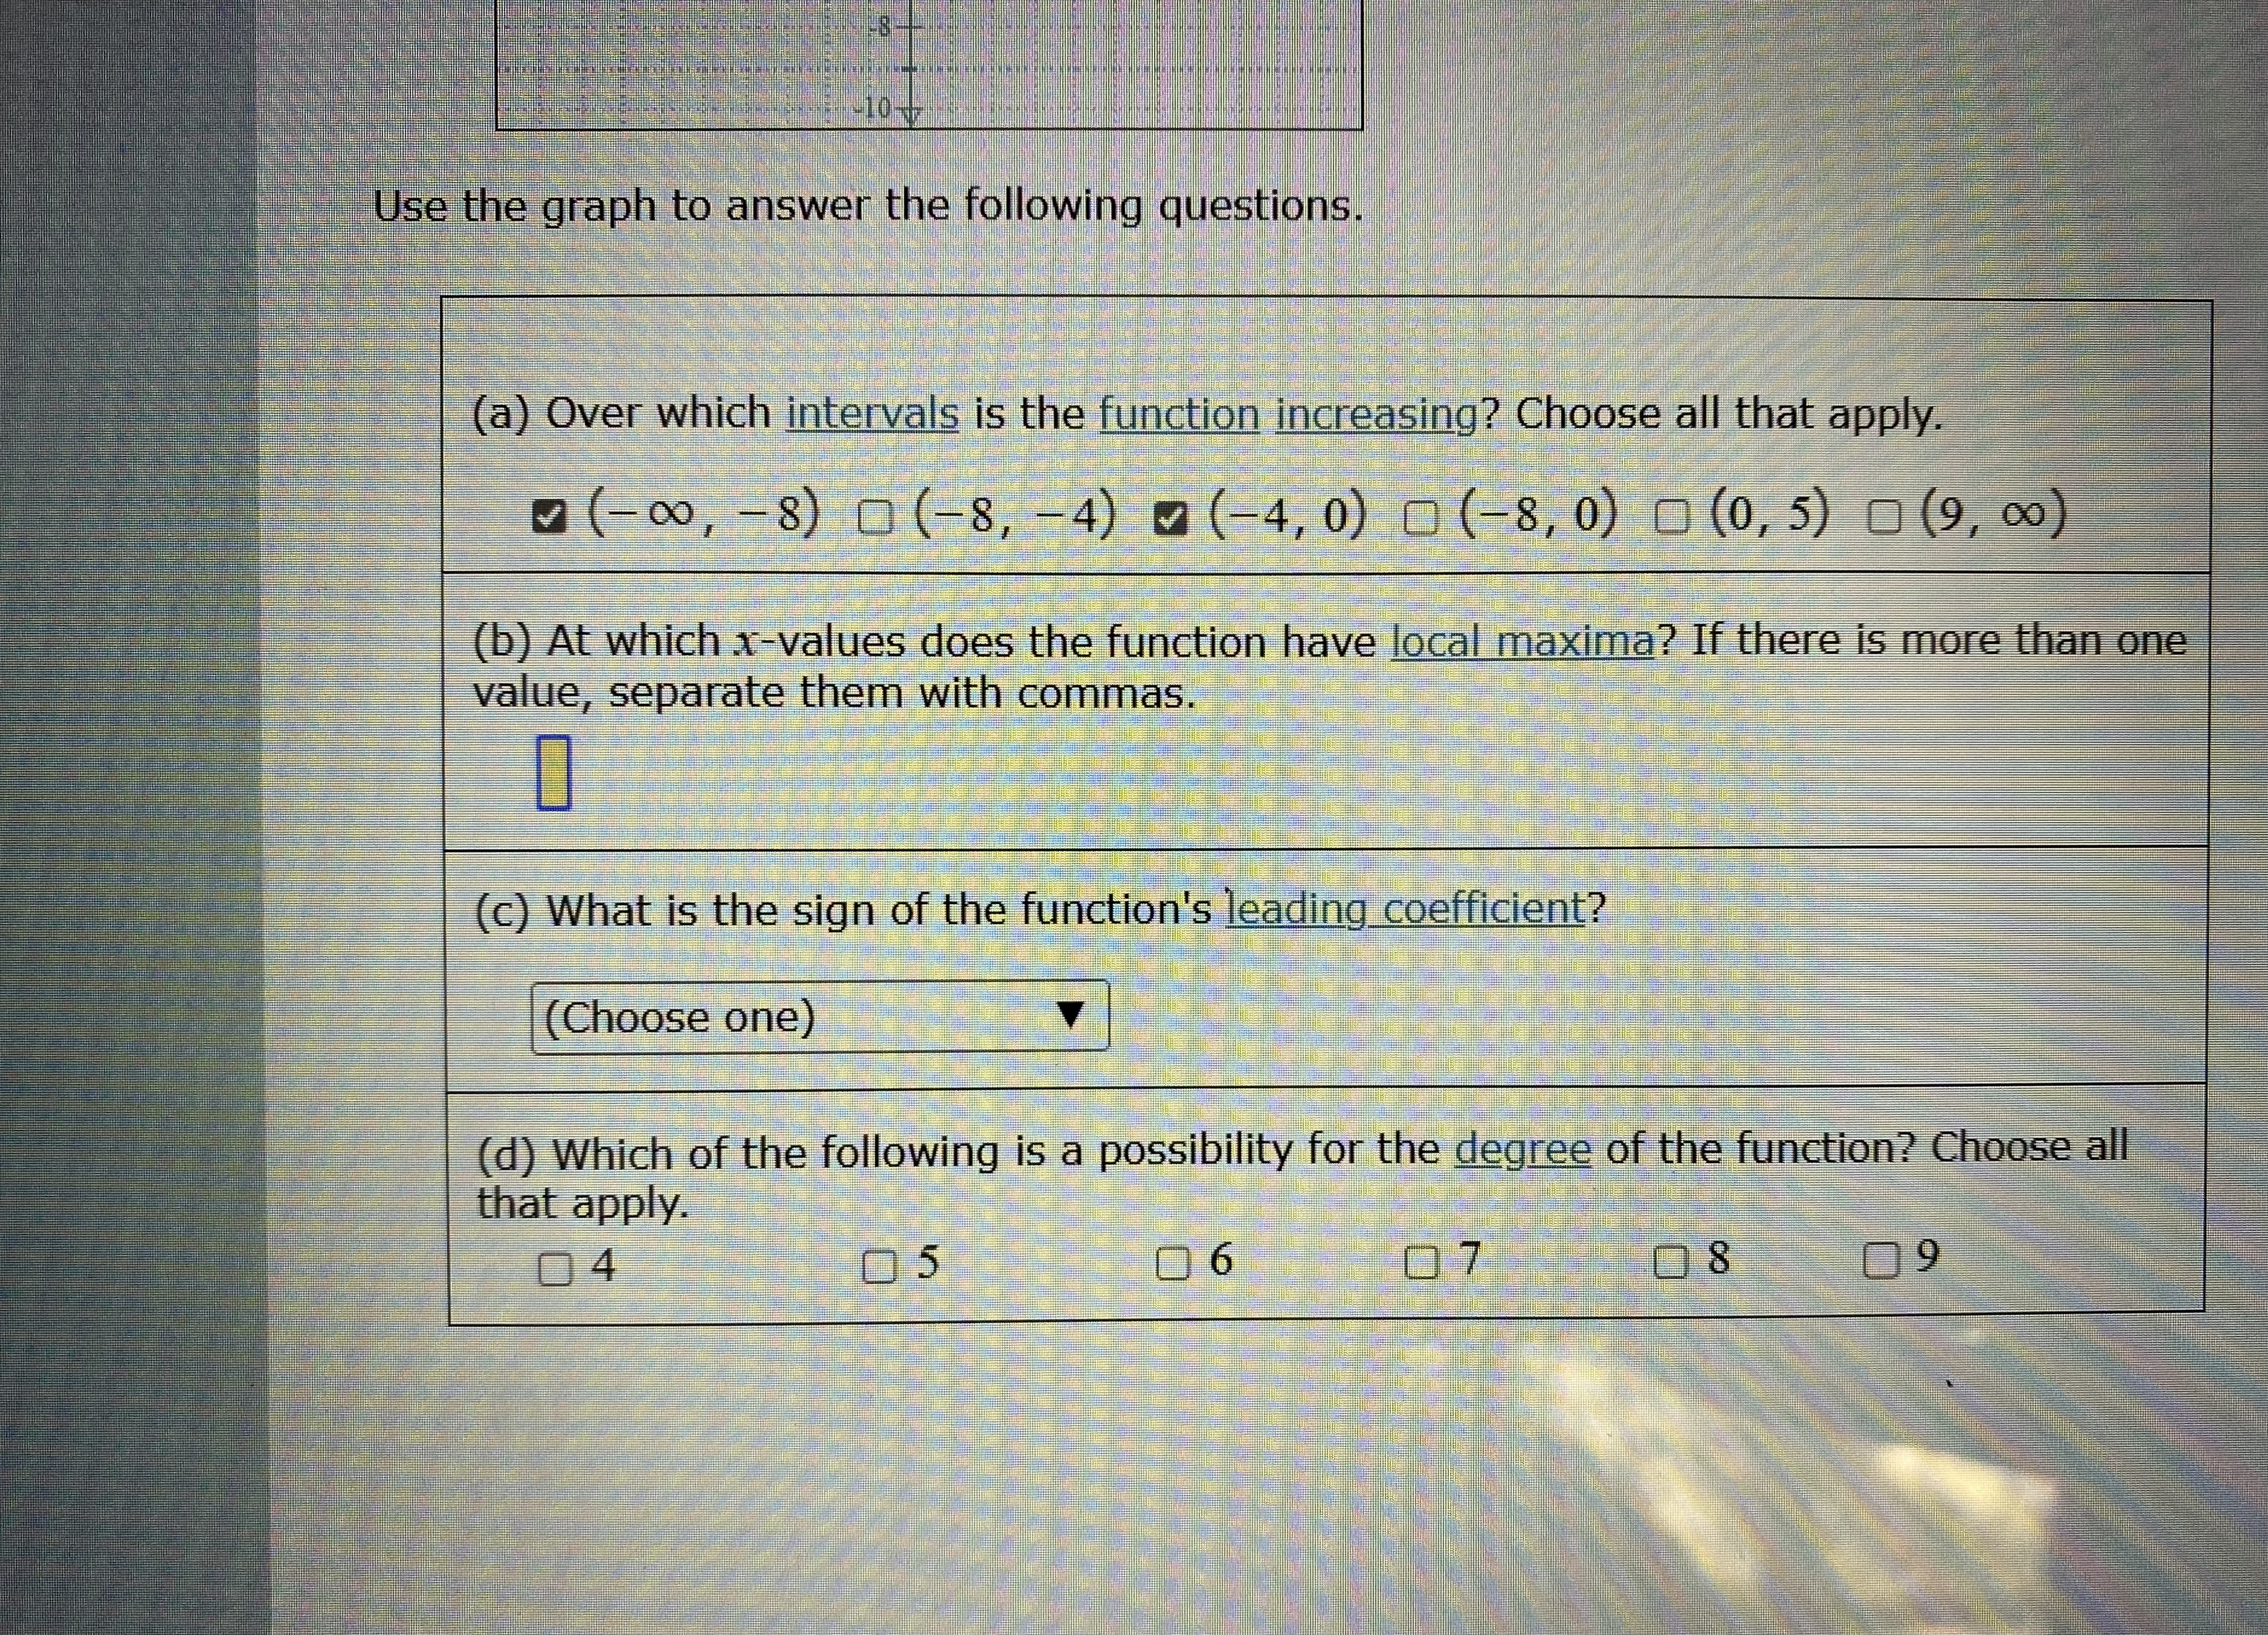
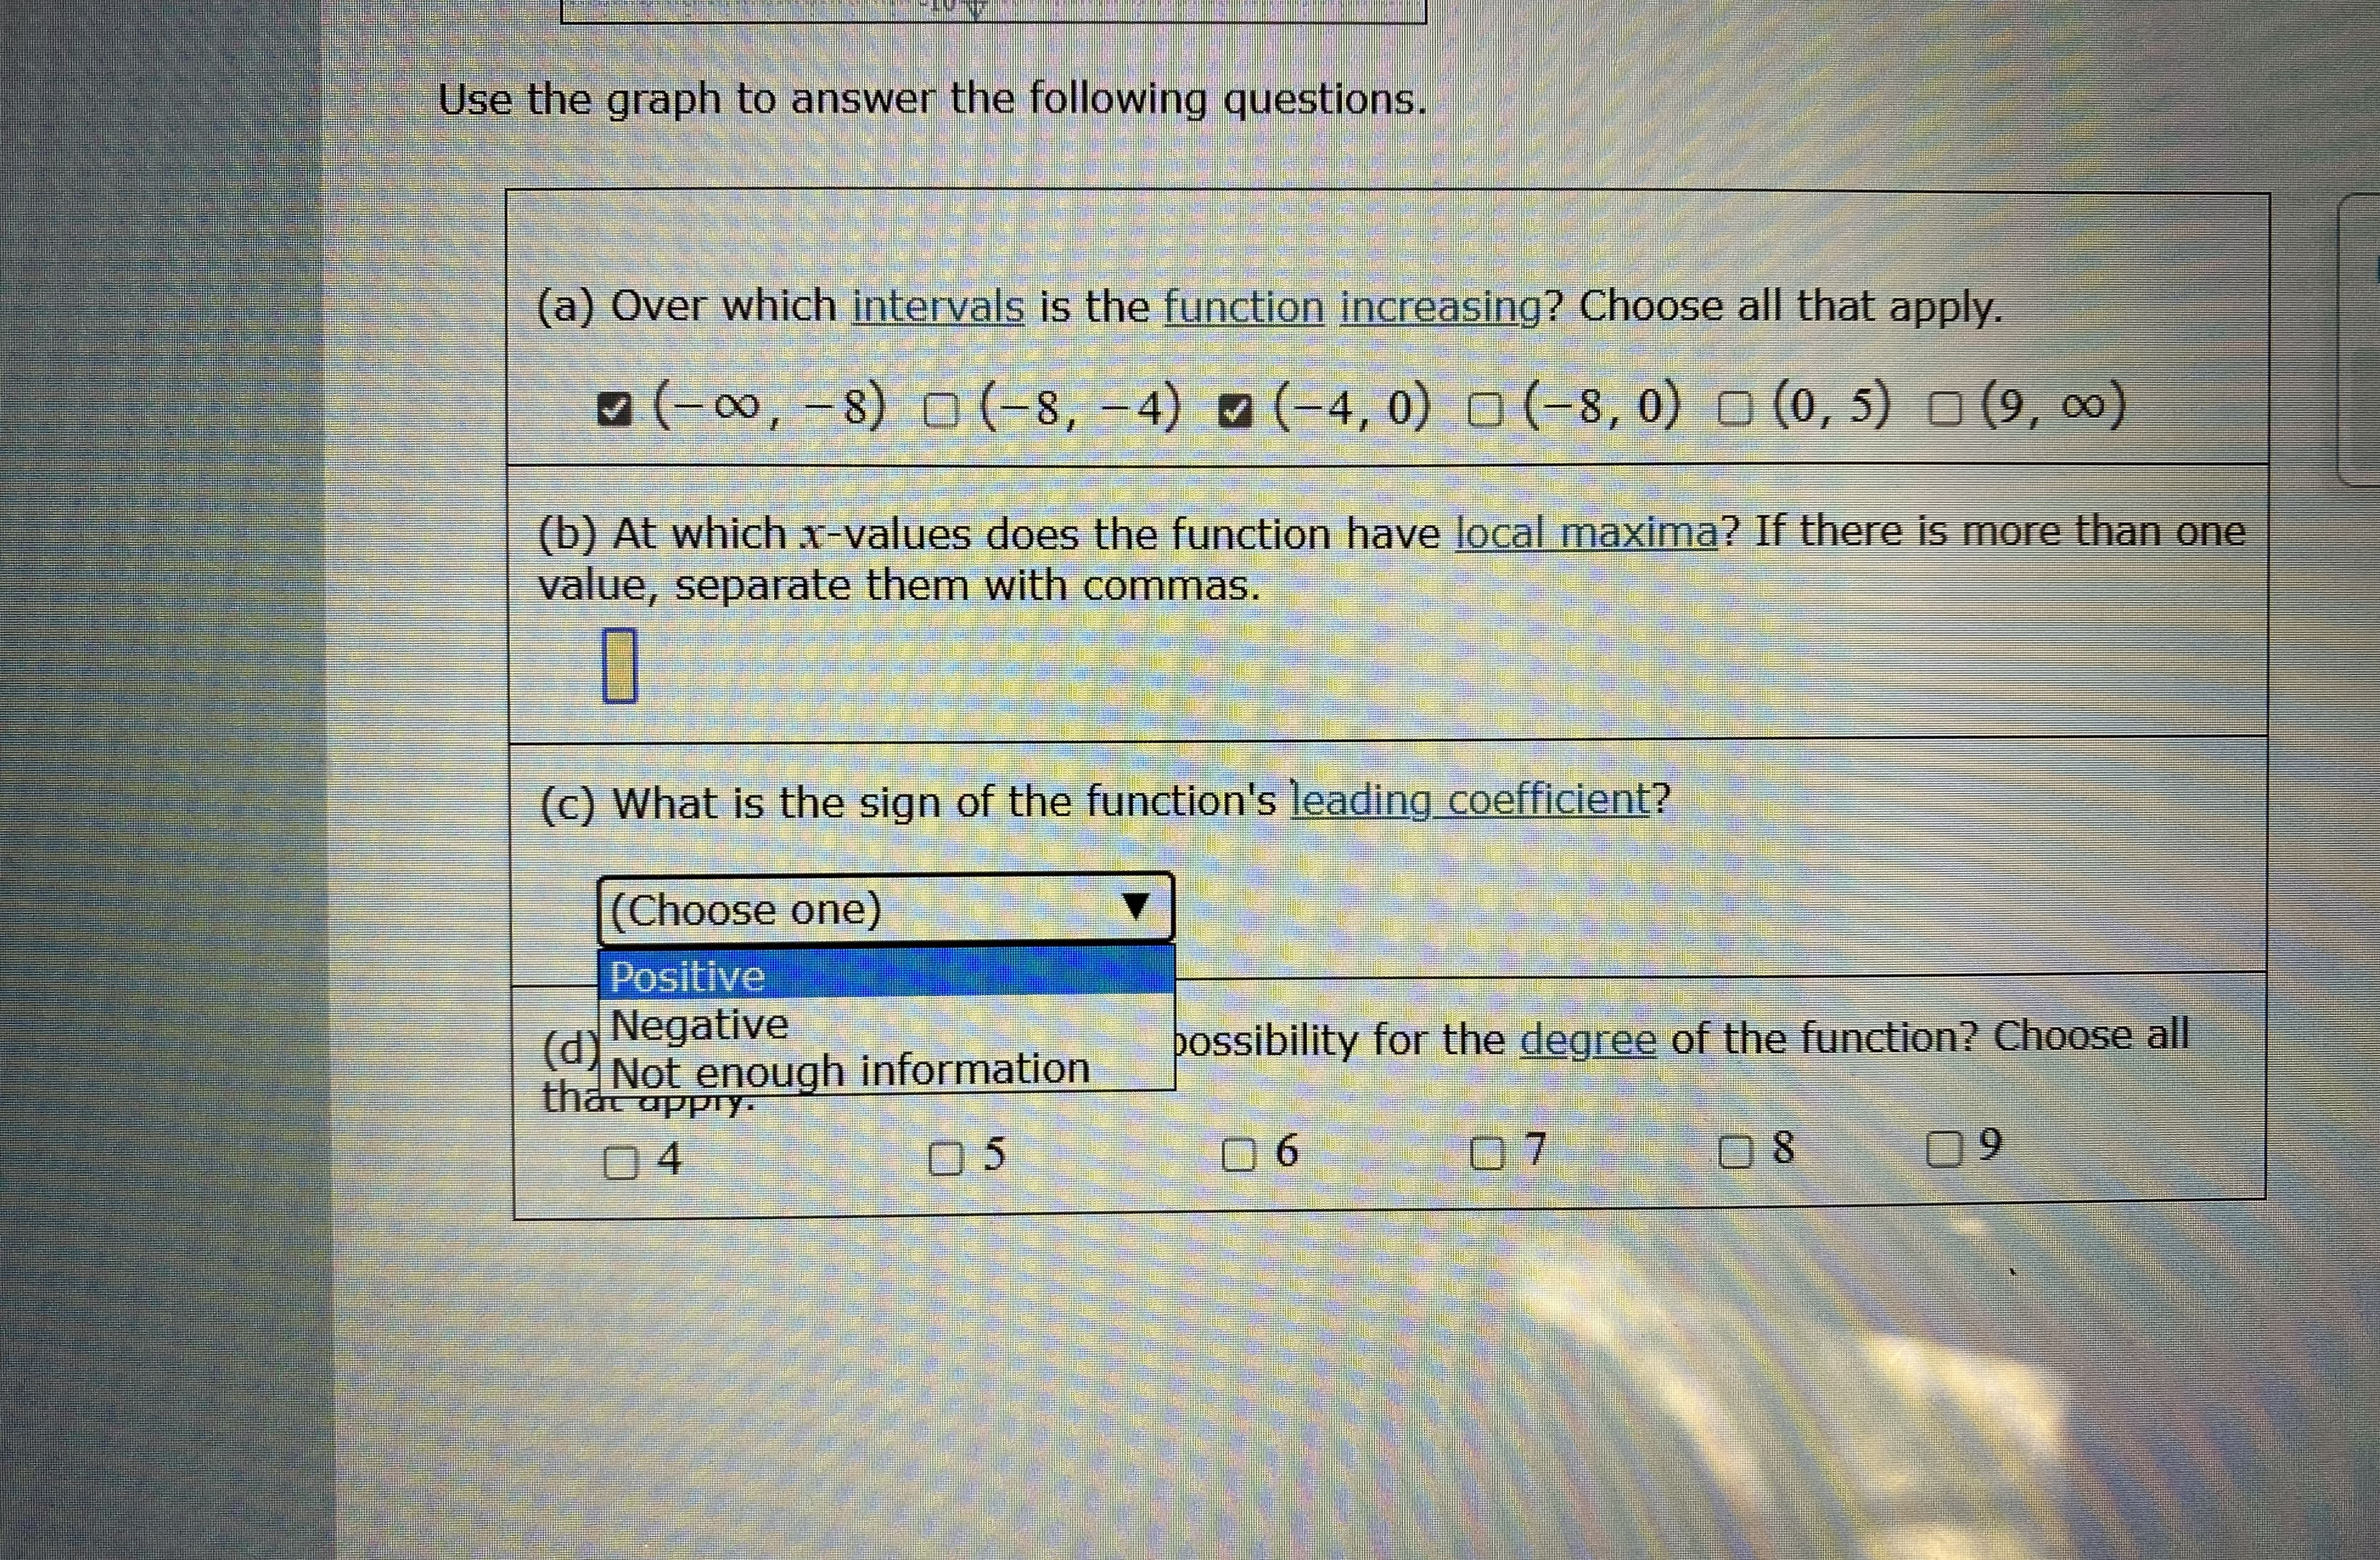
Below is the graph of a polynomial function with real coefficients. All local extrema of the function are shown in the graph. 10 4y Use the graph to answer the following questions. 0.0.... (a) Over which intervals is the function increasing? Choose all that apply. (-00, - 8) 0 (-8, -4) (-4, 0) 0 (-8, 0) (0, 5) (9, 00) X (b) At which x-values does the function have local maxima? If there is more than one value, separate them with commas.Use the graph to answer the following questions. (a) Over which intervals is the function increasing? Choose all that apply. (-00, - 8) 0 (-8, - 4) ~ (-4, 0) 0 (-8, 0) (0, 5) (9, 00) (b) At which x-values does the function have local maxima? If there is more than one value, separate them with commas. (c) What is the sign of the function's leading_coefficient? (Choose one) Positive (d) Negative Not enough information possibility for the degree of the function? Choose all that apply. 04 05 0 6 07 0 8 09
Step by Step Solution
There are 3 Steps involved in it

Get step-by-step solutions from verified subject matter experts