

Question: Below is the information for homework problem 12.1.2. Carry out an analysis such as that given in Figure 12.3 below using Excel's regression add-in. 2.
Below is the information for homework problem 12.1.2.
Carry out an analysis such as that given in Figure 12.3 below using Excel's regression add-in.
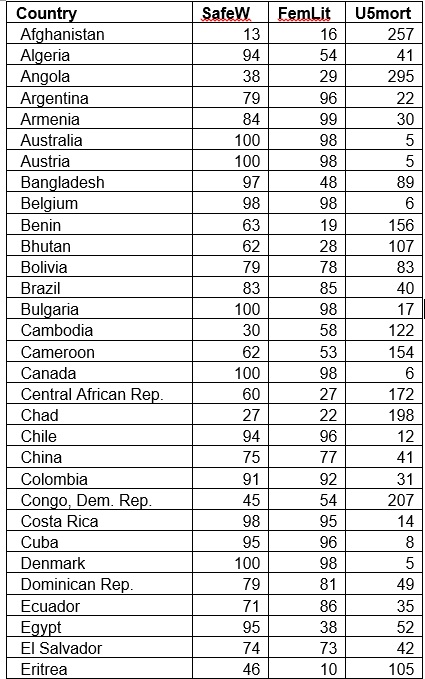
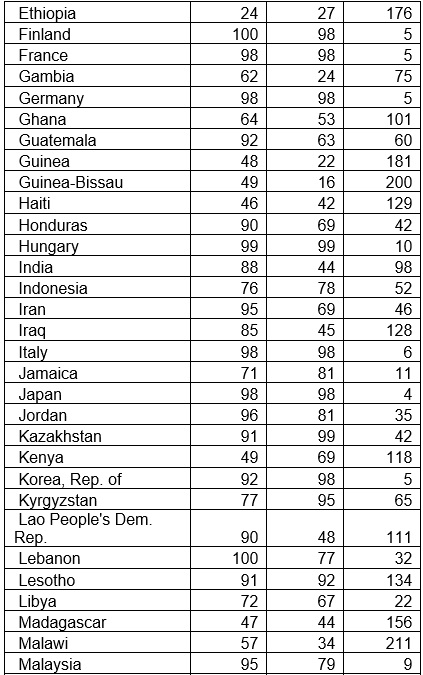
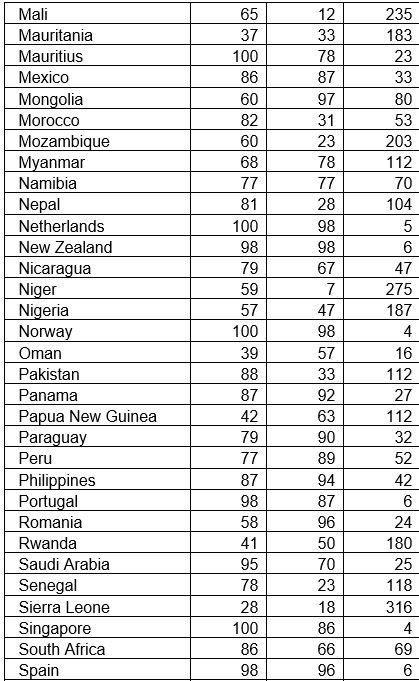
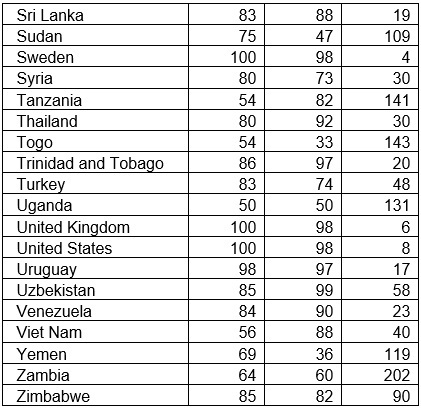
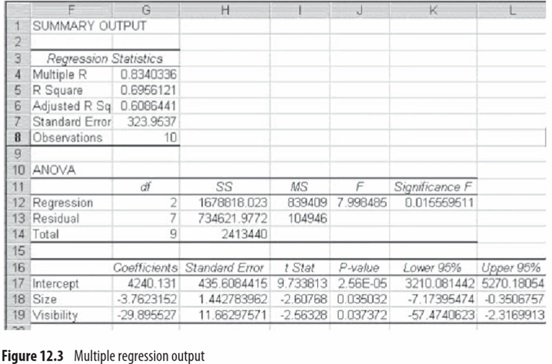
2. The data on the SWC worksheet of Chpt 12-1.xIs is taken from the State of the World's Children 2001 (2000). It shows rates of under-five mortality (USMort), female literacy (FemLit), and access to safe water (SafeW) for 113 countries of the world, each with more than 1 million inhabitants. Use the data to do the following: a. Carry out an analysis such as that given in Figure 12.3 by using Excel's regression add-in. To access the regression add-in, go to the Data ribbon, in the Analysis group, click the Data Analysis option, and then choose the Regression option.\f\f\f\fF G H K 1 SUMMARY OUTPUT N Regression Statistics Multiple R 0.8340336 R Square 0.6956121 Adjusted R Sq 0.6086441 7 Standard Error 323.9537 Observations 10 g 10 ANOVA 11 SS MS F Significance F 12 Regression 1678818.023 839409 7.998485 0.016569511 13 Residual 734621.9772 104946 14 Total 9 2413440 15 16 Coefficients Standard Error 1 Stat P-value Lower 95% Upper 95% 17 Intercept 4240.131 435.6084415 9.733813 2.56E-05 3210.081442 5270.18054 18 Size -3.7623152 1.442783962 -2.60768 0.035032 -7.17395474 -0.3506757 19 Visibility -29.895527 11.66297571 -2.56328 0.037372 -57.4740623 -2.3169913 Figure 12.3 Multiple regression output
Step by Step Solution
There are 3 Steps involved in it

Get step-by-step solutions from verified subject matter experts