

Question: Below is the statistics based on sixty monthly excess returns for the market index, the stock of Nike Inc. (NKE), and the stock of Starbucks
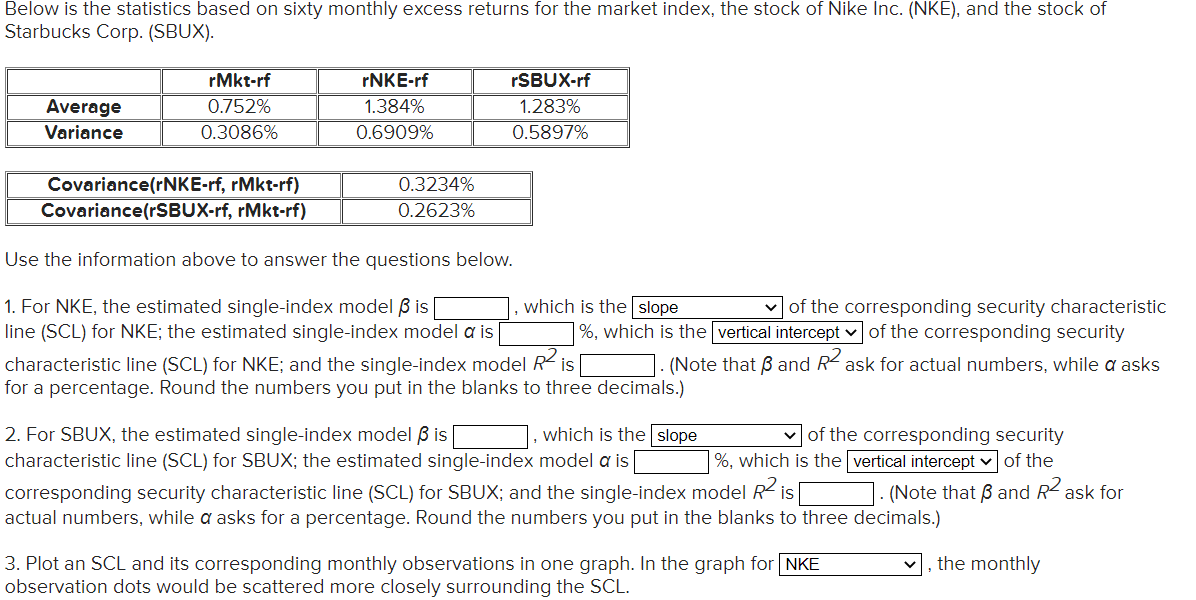
Below is the statistics based on sixty monthly excess returns for the market index, the stock of Nike Inc. (NKE), and the stock of Starbucks Corp. (SBUX). Use the information above to answer the questions below. 1. For NKE, the estimated single-index model is__ , which is the_ of the corresponding security characteristic line (SCL) for NKE; the estimated single-index model is %, which is the of the corresponding security characteristic line (SCL) for NKE; and the single-index model R2 is . . (Note that and R2 ask for actual numbers, while asks for a percentage. Round the numbers you put in the blanks to three decimals.) 2. For SBUX, the estimated single-index model is_, which is the of the corresponding security characteristic line (SCL) for SBUX; the estimated single-index model is %, which is the of the corresponding security characteristic line (SCL) for SBUX; and the single-index model R2 is . (Note that and R2 ask for actual numbers, while asks for a percentage. Round the numbers you put in the blanks to three decimals.) 3. Plot an SCL and its corresponding monthly observations in one graph. In the graph for , the monthly observation dots would be scattered more closely surrounding the SCL. Below is the statistics based on sixty monthly excess returns for the market index, the stock of Nike Inc. (NKE), and the stock of Starbucks Corp. (SBUX). Use the information above to answer the questions below. 1. For NKE, the estimated single-index model is__ , which is the_ of the corresponding security characteristic line (SCL) for NKE; the estimated single-index model is %, which is the of the corresponding security characteristic line (SCL) for NKE; and the single-index model R2 is . . (Note that and R2 ask for actual numbers, while asks for a percentage. Round the numbers you put in the blanks to three decimals.) 2. For SBUX, the estimated single-index model is_, which is the of the corresponding security characteristic line (SCL) for SBUX; the estimated single-index model is %, which is the of the corresponding security characteristic line (SCL) for SBUX; and the single-index model R2 is . (Note that and R2 ask for actual numbers, while asks for a percentage. Round the numbers you put in the blanks to three decimals.) 3. Plot an SCL and its corresponding monthly observations in one graph. In the graph for , the monthly observation dots would be scattered more closely surrounding the SCL
Step by Step Solution
There are 3 Steps involved in it

Get step-by-step solutions from verified subject matter experts