

Question: below is the table I created that the question is referring too question I am needing help with thank you! In our previous assignments we
below is the table I created that the question is referring too
question I am needing help with thank you!
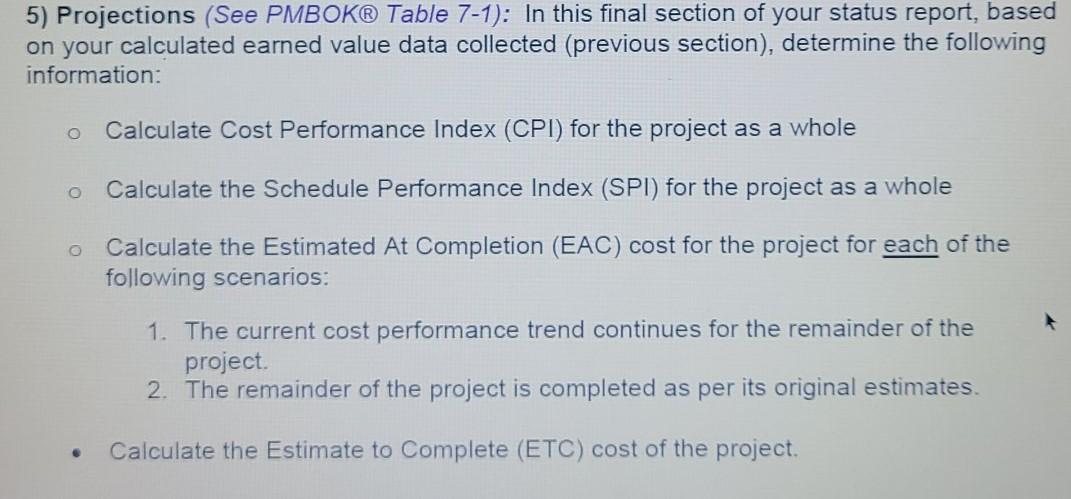
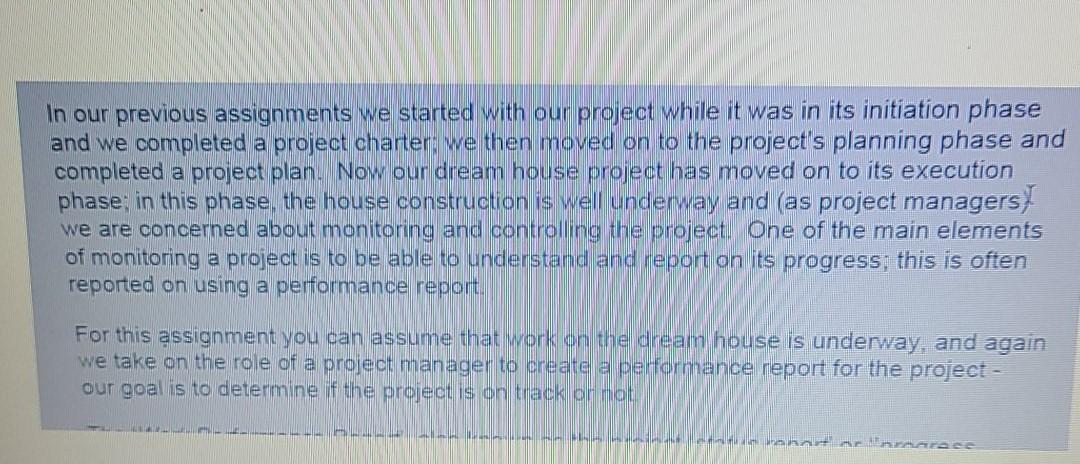
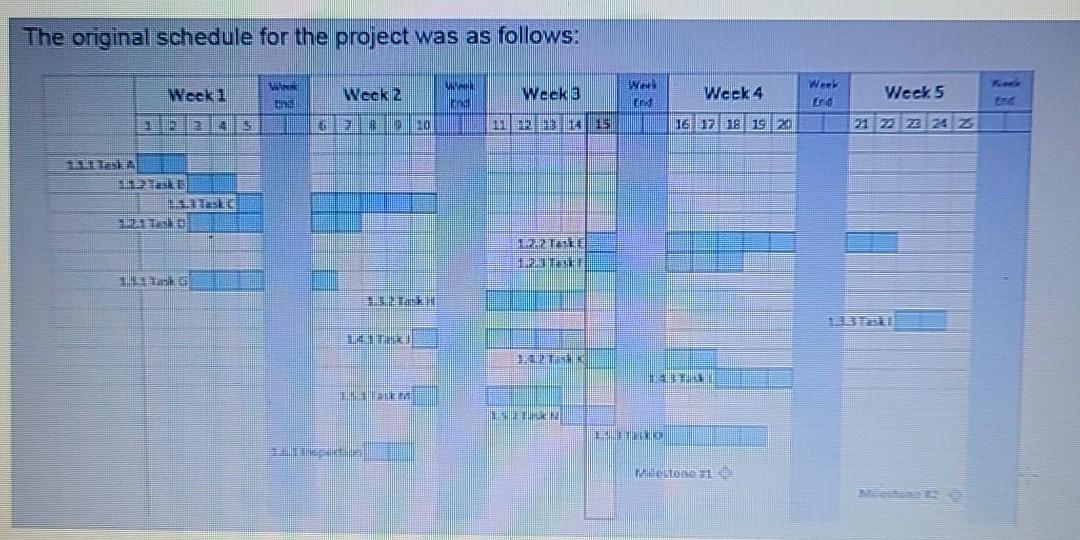
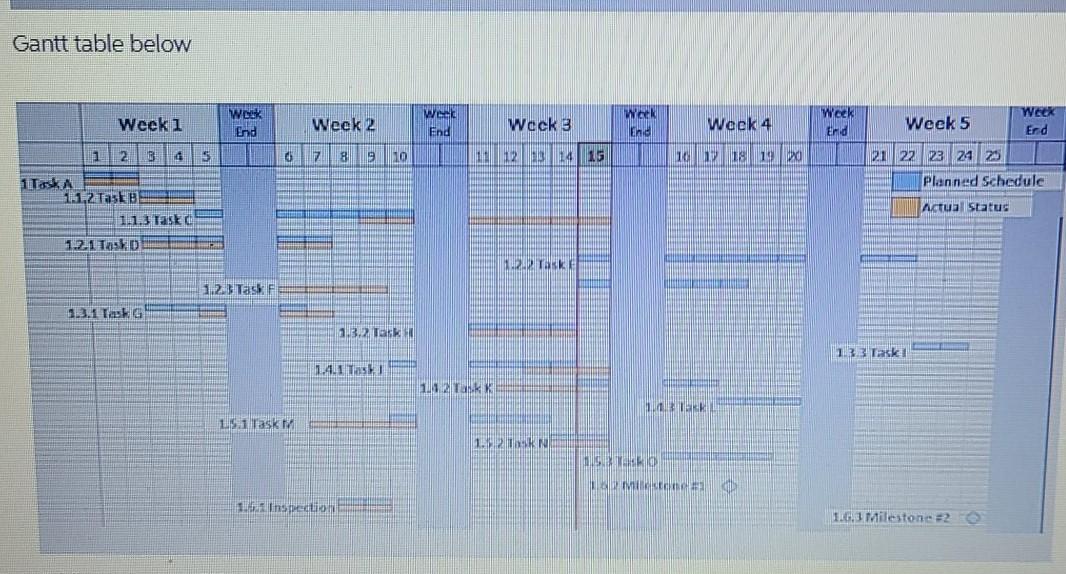
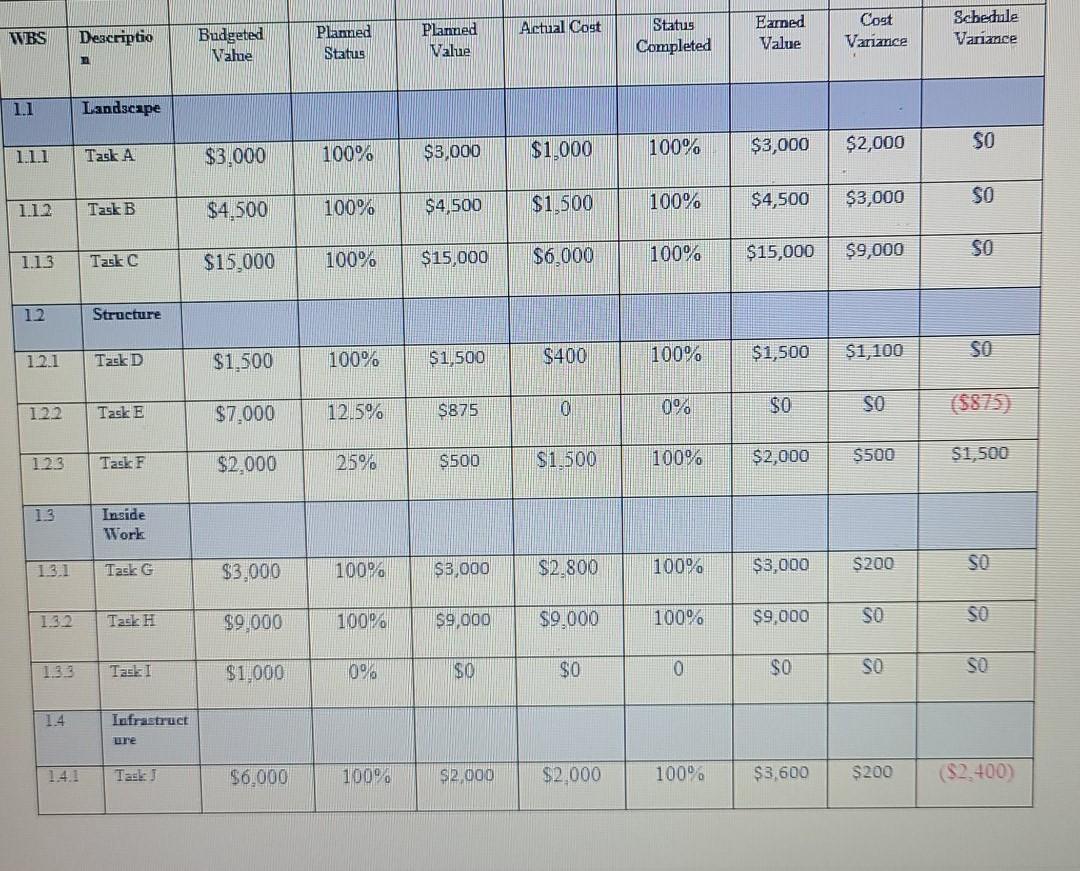
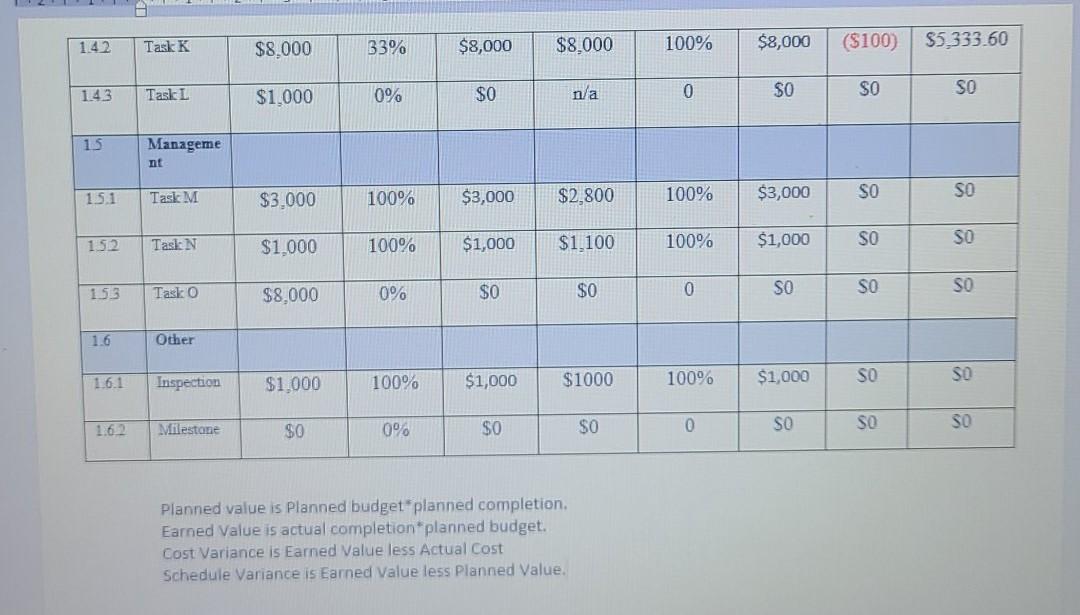
In our previous assignments we started with our project while it was in its initiation phase and we completed a project charter we then moved on to the project's planning phase and completed a project plan. Now our dream house project has moved on to its execution phase in this phase, the house construction is well underway and (as project managers we are concerned about monitoring and controlling the project One of the main elements of monitoring a project is to be able to understand and report on its progress, this is often reported on using a performance report. For this assignment you can assume that work on the dream house is underway, and again we take on the role of a project manager to create a performance report for the project - our goal is to determine the project is on track or not AL Wh The original schedule for the project was as follows: M M Weckl Week 2 Week 3 Week 4 1AM DESI Week 5 G10 11 13 15 TG 17 18 19 20 21 22 23 24 Z NELE OLLE PLE LO anka 21 TDS Gantt table below Week wek End Week 2 w End Wack 3 WA End Week 4 Week End Week 5 Erd Week 1 1 2 3 4 5 F 8 10 12G 10 12 14 19 21 22 23 24 25 Planned schedule Task 11.1.2Tas B 11.3 Task 12.11 Actual Status ASI 1.2. Task F 13.1 Tash 1.3.2 TGK 13 3 Task 1.4.1 Tai 1 TK TERE LS Task 1.NO SARIO MICE 16 Inspection Milestone 2 Actual Cost WBS Budgeted Value Descriptio Planned Status Planned Value Status Completed Earned Value Schedule Variance Cost Variance 1.1 Landscape Task A $3.000 100% $0 1.1.1 $3,000 $1,000 100% $2,000 $3,000 Tack B 1.1.2 $4,500 10000 SO $4,500 $1.500 100% $3,000 $4,500 1.13 Task C $15,000 100% SO $15,000 $6.000 $9,000 100% $15,000 12 Structure 12.1 Tak D $1,500 100% $1,500 $400 100% SO $1,500 $1,100 12.5% 12.2 $7,000 $875 0% $0 Task E 0 SO ($875) 123 Task F 25% $2,000 $500 $1.500 100% $2,000 S500 $1,500 13 Inside Work 13.1 Task G 100% $3,000 $3,000 $2.800 100% SO $3,000 $200 1.32 Tak H 100% $9,000 $9,000 $9.000 100% SO $9,000 SO Tack I $1,000 008 $0 $0 0 $o SO So 1.4 Infrastruct ure 1.4.1 Task $6,000 100% $2.000 $2.000 100% $3,600 $200 ($2.400) 142 Task K $8,000 33% $8,000 $8,000 100% $8,000 ($100) $5.333.60 143 Task L 0% $0 $1,000 n/a 0 SO SO SO 15 Manageme nt 15.1 Task M $3.000 100% $3,000 $2,800 100% SO $3,000 SO 1512 Task N $1,000 100% $1,000 $1,100 SO 100% $1,000 SO 153 Task O 0% $8.000 $0 $0 0 SO SO SO 1.6 Other 16.1 Inspection SO $1,000 SO 100% $1000 $1,000 100% $1,000 Milestone 1.62 0% $0 $0 SO 0 SO 50 SO Planned value is planned budget planned completion Earned Value is actual completion planned budget. Cost Variance is Earned Value less Actual Cost Schedule Variance is Earned Value less Planned Value. 5) Projections (See PMBOK Table 7-1): In this final section of your status report, based on your calculated earned value data collected (previous section), determine the following information: O Calculate Cost Performance Index (CPI) for the project as a whole Calculate the Schedule Performance Index (SPI) for the project as a whole Calculate the Estimated At Completion (EAC) cost for the project for each of the following scenarios: 1. The current cost performance trend continues for the remainder of the project. 2. The remainder of the project is completed as per its original estimates. Calculate the Estimate to Complete (ETC) cost of the project. In our previous assignments we started with our project while it was in its initiation phase and we completed a project charter we then moved on to the project's planning phase and completed a project plan. Now our dream house project has moved on to its execution phase in this phase, the house construction is well underway and (as project managers we are concerned about monitoring and controlling the project One of the main elements of monitoring a project is to be able to understand and report on its progress, this is often reported on using a performance report. For this assignment you can assume that work on the dream house is underway, and again we take on the role of a project manager to create a performance report for the project - our goal is to determine the project is on track or not AL Wh The original schedule for the project was as follows: M M Weckl Week 2 Week 3 Week 4 1AM DESI Week 5 G10 11 13 15 TG 17 18 19 20 21 22 23 24 Z NELE OLLE PLE LO anka 21 TDS Gantt table below Week wek End Week 2 w End Wack 3 WA End Week 4 Week End Week 5 Erd Week 1 1 2 3 4 5 F 8 10 12G 10 12 14 19 21 22 23 24 25 Planned schedule Task 11.1.2Tas B 11.3 Task 12.11 Actual Status ASI 1.2. Task F 13.1 Tash 1.3.2 TGK 13 3 Task 1.4.1 Tai 1 TK TERE LS Task 1.NO SARIO MICE 16 Inspection Milestone 2 Actual Cost WBS Budgeted Value Descriptio Planned Status Planned Value Status Completed Earned Value Schedule Variance Cost Variance 1.1 Landscape Task A $3.000 100% $0 1.1.1 $3,000 $1,000 100% $2,000 $3,000 Tack B 1.1.2 $4,500 10000 SO $4,500 $1.500 100% $3,000 $4,500 1.13 Task C $15,000 100% SO $15,000 $6.000 $9,000 100% $15,000 12 Structure 12.1 Tak D $1,500 100% $1,500 $400 100% SO $1,500 $1,100 12.5% 12.2 $7,000 $875 0% $0 Task E 0 SO ($875) 123 Task F 25% $2,000 $500 $1.500 100% $2,000 S500 $1,500 13 Inside Work 13.1 Task G 100% $3,000 $3,000 $2.800 100% SO $3,000 $200 1.32 Tak H 100% $9,000 $9,000 $9.000 100% SO $9,000 SO Tack I $1,000 008 $0 $0 0 $o SO So 1.4 Infrastruct ure 1.4.1 Task $6,000 100% $2.000 $2.000 100% $3,600 $200 ($2.400) 142 Task K $8,000 33% $8,000 $8,000 100% $8,000 ($100) $5.333.60 143 Task L 0% $0 $1,000 n/a 0 SO SO SO 15 Manageme nt 15.1 Task M $3.000 100% $3,000 $2,800 100% SO $3,000 SO 1512 Task N $1,000 100% $1,000 $1,100 SO 100% $1,000 SO 153 Task O 0% $8.000 $0 $0 0 SO SO SO 1.6 Other 16.1 Inspection SO $1,000 SO 100% $1000 $1,000 100% $1,000 Milestone 1.62 0% $0 $0 SO 0 SO 50 SO Planned value is planned budget planned completion Earned Value is actual completion planned budget. Cost Variance is Earned Value less Actual Cost Schedule Variance is Earned Value less Planned Value. 5) Projections (See PMBOK Table 7-1): In this final section of your status report, based on your calculated earned value data collected (previous section), determine the following information: O Calculate Cost Performance Index (CPI) for the project as a whole Calculate the Schedule Performance Index (SPI) for the project as a whole Calculate the Estimated At Completion (EAC) cost for the project for each of the following scenarios: 1. The current cost performance trend continues for the remainder of the project. 2. The remainder of the project is completed as per its original estimates. Calculate the Estimate to Complete (ETC) cost of the project
Step by Step Solution
There are 3 Steps involved in it

Get step-by-step solutions from verified subject matter experts