

Question: Below the output, first report the total-final correlation including degrees of freedom, correlation coefficient, and p value. Specify whether or not to reject the null
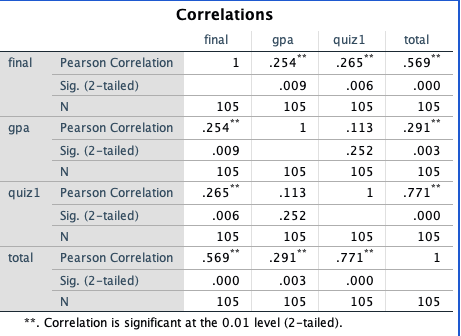
- Below the output, first report the total-final correlation including degrees of freedom, correlation coefficient, and p value. Specify whether or not to reject the null hypothesis for this correlation.
- Second, report the gpa-quiz1 correlation including degrees of freedom, correlation coefficient, and p value. Specify whether or not to reject the null hypothesis for this correlation.

Correlations final gpa quiz1 total final Pearson Correlation 1 254 .265 569 Sig. (2-tailed) 009 006 000 N 105 105 105 105 gpa Pearson Correlation .254 .113 291 Sig. (2-tailed) 009 252 003 N 105 105 105 105 quiz 1 Pearson Correlation .265 .113 1 .771 Sig. (2-tailed) 006 .252 .000 N 105 105 105 105 total Pearson Correlation .569 291 # # 771 1 Sig. (2-tailed) .000 003 000 N 105 105 105 105 **. Correlation is significant at the 0.01 level (2-tailed)
Step by Step Solution
There are 3 Steps involved in it
1 Expert Approved Answer
Step: 1 Unlock

Question Has Been Solved by an Expert!
Get step-by-step solutions from verified subject matter experts
Step: 2 Unlock
Step: 3 Unlock