

Question: Below you are given a training set of samples with two features each belonging to one of two classes. Plot these samples into a 2D
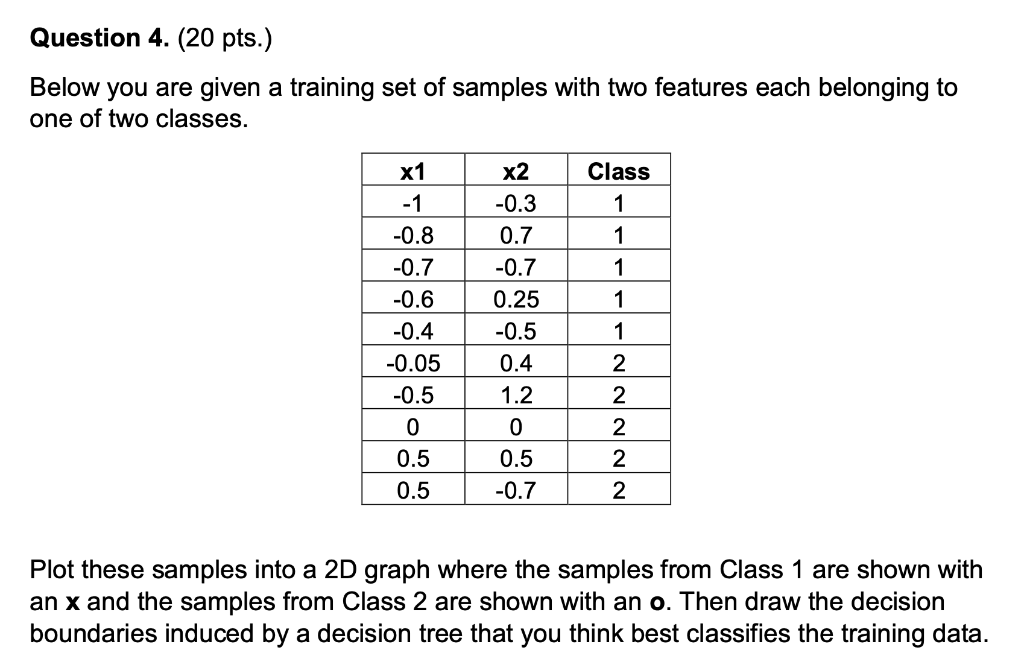
Below you are given a training set of samples with two features each belonging to one of two classes. Plot these samples into a 2D graph where the samples from Class 1 are shown with an x and the samples from Class 2 are shown with an 0 . Then draw the decision boundaries induced by a decision tree that you think best classifies the training data
Step by Step Solution
There are 3 Steps involved in it
1 Expert Approved Answer
Step: 1 Unlock

Question Has Been Solved by an Expert!
Get step-by-step solutions from verified subject matter experts
Step: 2 Unlock
Step: 3 Unlock