

Question: Below you will find an Excel file with three tabs. Each tab contains three recent income statements of a different company. The three companies include:
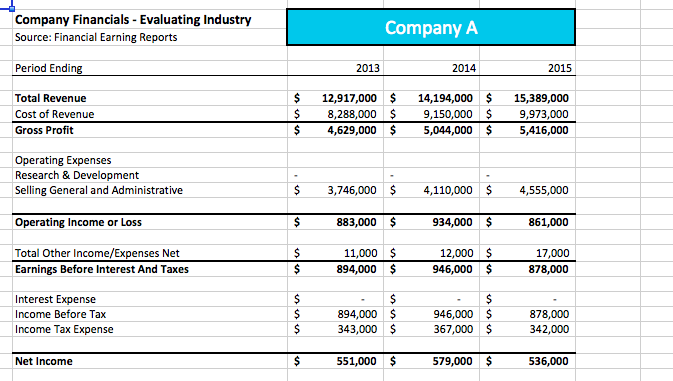
Below you will find an Excel file with three tabs. Each tab contains three recent income statements of a different company. The three companies include: technology company a an e-commerce corporation . specialized supermarket chain a Comparing Companies Spreadsheet [xlsx] To measure profitability, calculate the following: Operating margins for all years and companies. Each value should be to two decimal places. Net income margins for all years and companies. Each value should be to two decimal places. CAGR for total revenue from 2012-2014. Each value should be to two decimal places. Action: Use the attached spreadsheet to calculate operating margin, net income margins, and CAGR for each of the organizations. Company Financials Evaluating Industry Company A Source: Financial Earning Reports Period Ending 2013 2014 2015 12,917,000 $ Total Revenue 14,194,000 15,389,000 9,973,000 Cost of Revenue 8,288,000 9,150,000 4,629,000 $ Gross Profit 5,044,000 5,416,000 Operating Expenses Research & Development Selling General and Administrative 4,110,000 $ 3,746,000 4,555,000 $ 934,000 $ 883,000 $ Operating Income or Loss 861,000 Total Other Income/Expenses Net Earnings Before Interest And Taxes 12,000 $ 11,000 $ 17,000 $ 894,000 $ 946,000 878,000 Interest Expense Income Before Tax 946,000 $ 367,000 $ 894,000 878,000 342,000 343,000 $ Income Tax Expense 579,000 $ Net Income 551,000 536,000
Step by Step Solution
There are 3 Steps involved in it

Get step-by-step solutions from verified subject matter experts