

Question: Benchmarking Draw conclusions from revenues compared to costs how could money be saved? what suggestions could be made? 484 CHAPTER 33 Case Study: Metropolis Health
Benchmarking
Draw conclusions from revenues compared to costs
how could money be saved? what suggestions could be made?
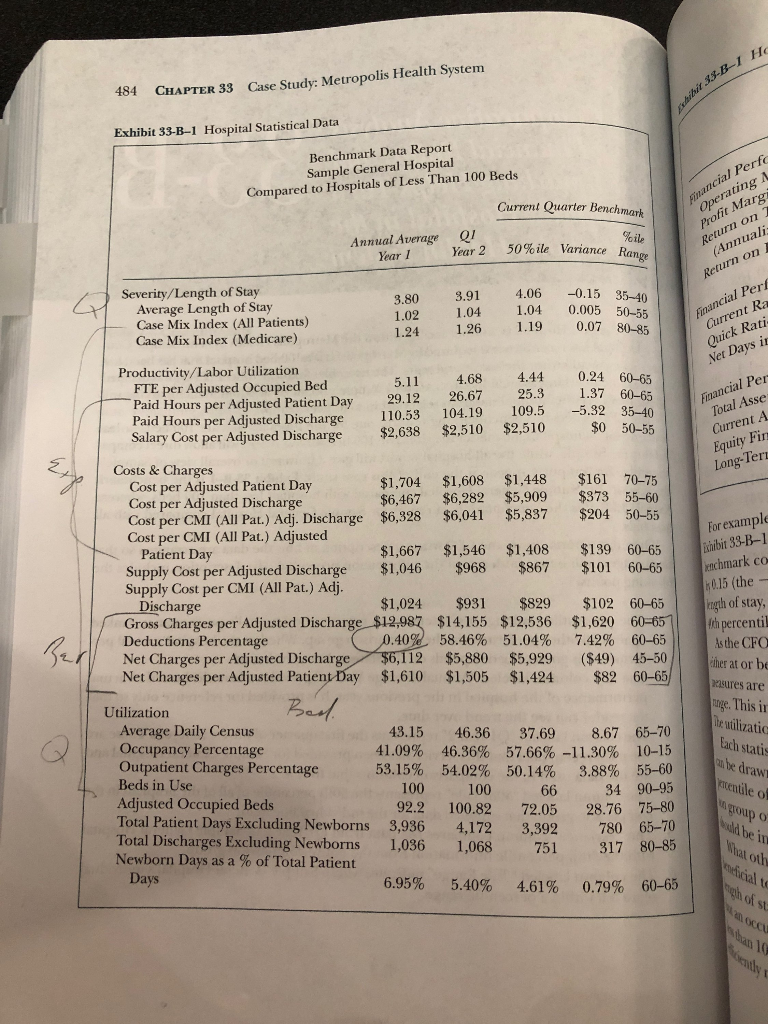
484 CHAPTER 33 Case Study: Metropolis Health System it 35-B Exhibit 33-B-1 Hospital Statistical Data Benchmark Data Report Sample General Hospital Compared to Hospitals of Less Than 100 Beds inancial Perfc Operating A Current Quarter Benchmark %ile 50% ile Variance Ranne Annual Average Year 1 Q1 Year 2 Profit Marg Return on (Annuali Return on Severity/Length of Stay Average Length of Stay Case Mix Index (All Patients) Case Mix Index (Medicare) 3.80 1.02 1.24 3.91 1.04 1.26 4.06 1.04 1.19 -0.15 0.005 0.07 35-40 50-55 80-85 Financial Per Current Ra Quick Rati Net Days ir 5.11 Productivity/Labor Utilization FTE per Adjusted Occupied Bed Paid Hours per Adjusted Patient Day Paid Hours per Adjusted Discharge Salary Cost per Adjusted Discharge 29.12 110.53 $2,638 4.68 26.67 104.19 $2,510 4.44 25.3 109.5 $2,510 0.24 60-65 1.37 60-65 -5.32 35-40 $0 50-55 Financial Per Total Asse Current A Equity Fir: Long-Tere For example ixhibit 33-B-1 enchmark co k0.15 (the- ength of stay, Ich percentil As the CFC cher at or be Costs & Charges $1,704 Cost per Adjusted Patient Day $1,608 $1,448 $161 70-75 $6,467 Cost per Adjusted Discharge $6,282 $373 55-60 $5,909 Cost per CMI (All Pat.) Adj. Discharge $6,328 $6,041 $5,837 $204 50-55 Cost per CMI (All Pat.) Adjusted Patient Day $1,667 $1,546 $1,408 $139 60-65 Supply Cost per Adjusted Discharge $1,046 $968 $867 $101 60-65 Supply Cost per CMI (All Pat.) Adj. Discharge $1,024 $931 $829 $102 60-65 Gross Charges per Adjusted Discharge $12,987 $14,155 $12,536 $1,620 60-65 Deductions Percentage ( 0.40% 58.46% 51.04% 7.42% 60-65 Net Charges per Adjusted Discharge $6,112 $5,880 $5,929 ($49) 45-50 Net Charges per Adjusted Patient Day $1,610 $1,505 $1,424 $82 60-65 Utilization Bech Average Daily Census 43.15 46.36 37.698.67 65-70 Occupancy Percentage 41.09% 46.36% 57.66% -11.30% 10-15 Outpatient Charges Percentage 53.15% 54.02% 50.14% 3.88% 55-60 Beds in Use 100 100 66 34 90-95 Adjusted Occupied Beds 92.2 100.82 28.76 75-80 Total Patient Days Excluding Newborns 3,936 4,172 3,392 780 65-70 Total Discharges Excluding Newborns 1,036 1,068 751 317 80-85 Newborn Days as a % of Total Patient Days 6.95% 5.40% 4.61% 0.79% 60-65 masures are ange. This is leutilizatic lach statis be draw kwendile of in group of be is koeficial to 484 CHAPTER 33 Case Study: Metropolis Health System it 35-B Exhibit 33-B-1 Hospital Statistical Data Benchmark Data Report Sample General Hospital Compared to Hospitals of Less Than 100 Beds inancial Perfc Operating A Current Quarter Benchmark %ile 50% ile Variance Ranne Annual Average Year 1 Q1 Year 2 Profit Marg Return on (Annuali Return on Severity/Length of Stay Average Length of Stay Case Mix Index (All Patients) Case Mix Index (Medicare) 3.80 1.02 1.24 3.91 1.04 1.26 4.06 1.04 1.19 -0.15 0.005 0.07 35-40 50-55 80-85 Financial Per Current Ra Quick Rati Net Days ir 5.11 Productivity/Labor Utilization FTE per Adjusted Occupied Bed Paid Hours per Adjusted Patient Day Paid Hours per Adjusted Discharge Salary Cost per Adjusted Discharge 29.12 110.53 $2,638 4.68 26.67 104.19 $2,510 4.44 25.3 109.5 $2,510 0.24 60-65 1.37 60-65 -5.32 35-40 $0 50-55 Financial Per Total Asse Current A Equity Fir: Long-Tere For example ixhibit 33-B-1 enchmark co k0.15 (the- ength of stay, Ich percentil As the CFC cher at or be Costs & Charges $1,704 Cost per Adjusted Patient Day $1,608 $1,448 $161 70-75 $6,467 Cost per Adjusted Discharge $6,282 $373 55-60 $5,909 Cost per CMI (All Pat.) Adj. Discharge $6,328 $6,041 $5,837 $204 50-55 Cost per CMI (All Pat.) Adjusted Patient Day $1,667 $1,546 $1,408 $139 60-65 Supply Cost per Adjusted Discharge $1,046 $968 $867 $101 60-65 Supply Cost per CMI (All Pat.) Adj. Discharge $1,024 $931 $829 $102 60-65 Gross Charges per Adjusted Discharge $12,987 $14,155 $12,536 $1,620 60-65 Deductions Percentage ( 0.40% 58.46% 51.04% 7.42% 60-65 Net Charges per Adjusted Discharge $6,112 $5,880 $5,929 ($49) 45-50 Net Charges per Adjusted Patient Day $1,610 $1,505 $1,424 $82 60-65 Utilization Bech Average Daily Census 43.15 46.36 37.698.67 65-70 Occupancy Percentage 41.09% 46.36% 57.66% -11.30% 10-15 Outpatient Charges Percentage 53.15% 54.02% 50.14% 3.88% 55-60 Beds in Use 100 100 66 34 90-95 Adjusted Occupied Beds 92.2 100.82 28.76 75-80 Total Patient Days Excluding Newborns 3,936 4,172 3,392 780 65-70 Total Discharges Excluding Newborns 1,036 1,068 751 317 80-85 Newborn Days as a % of Total Patient Days 6.95% 5.40% 4.61% 0.79% 60-65 masures are ange. This is leutilizatic lach statis be draw kwendile of in group of be is koeficial to
Step by Step Solution
There are 3 Steps involved in it

Get step-by-step solutions from verified subject matter experts