

Question: BETA Risk market premium 5 year Operating Leverage Beta and financial leverage Cost of equity Cost of Debt WACC Cost of Capital and Firm Value
BETA
Risk market premium 5 year
Operating Leverage
Beta and financial leverage
Cost of equity
Cost of Debt

WACC
Cost of Capital and Firm Value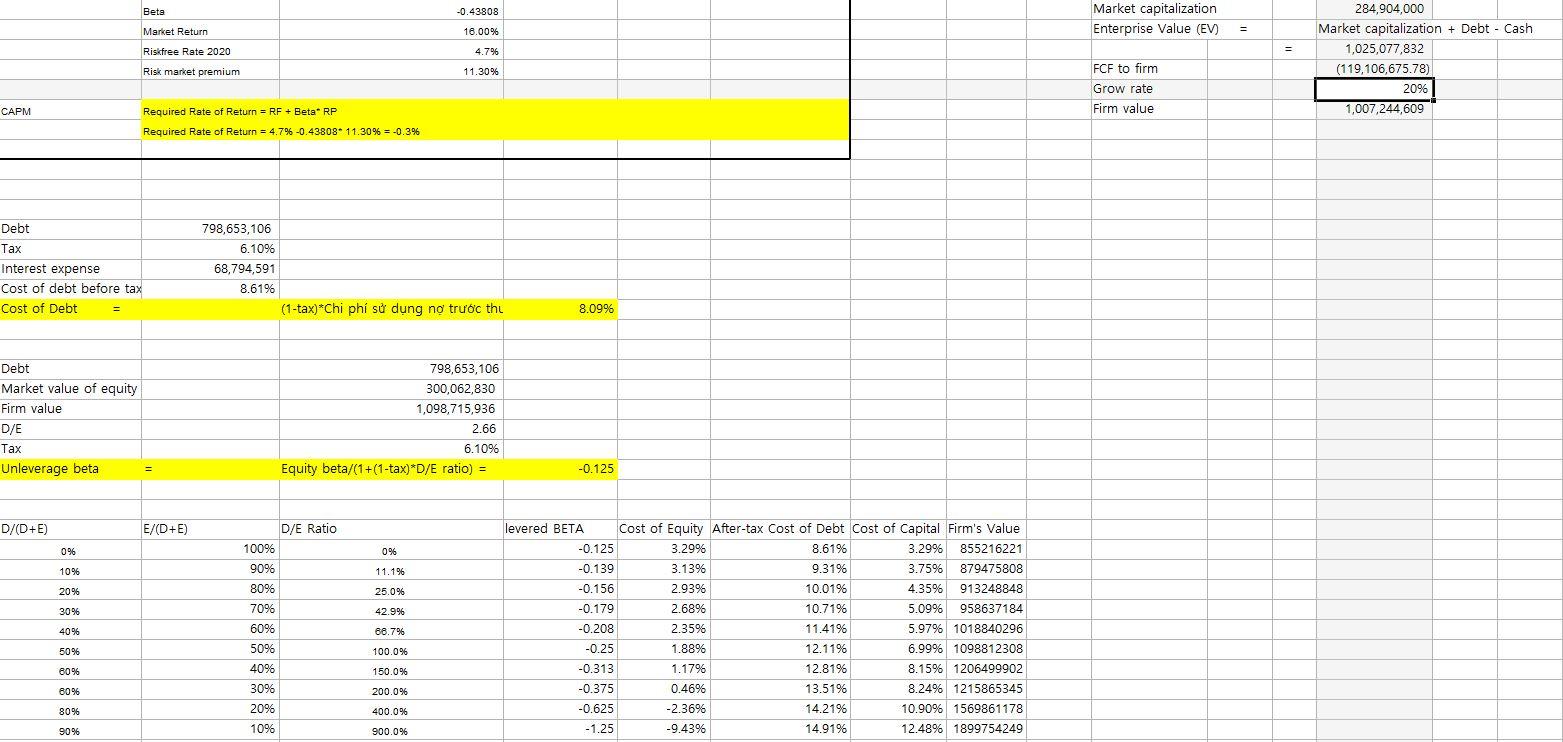
Firm value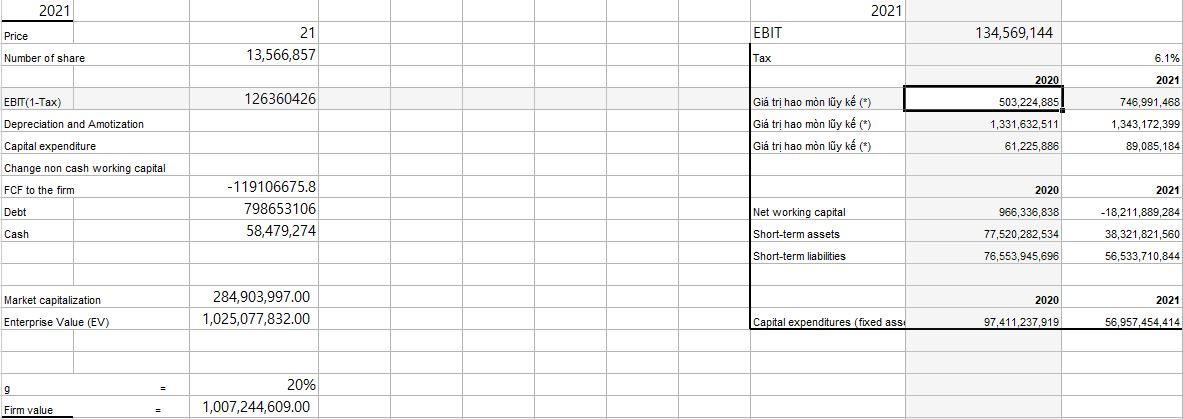
Analysis of the 9 items, and if there are improvement plans or pros and cons, please write, thank you very much.
I'm very sorry for the non-English language mix, but we would appreciate it if you could give a rough analysis by looking at the figures and items.
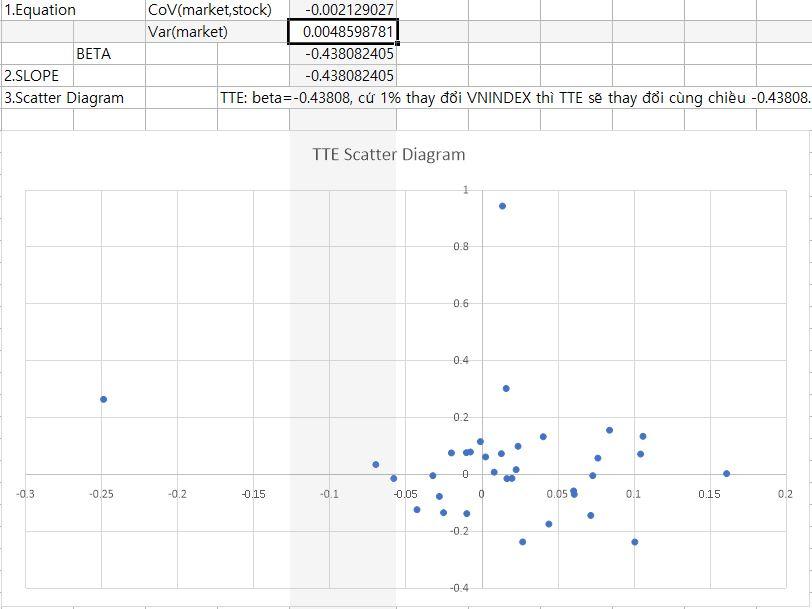
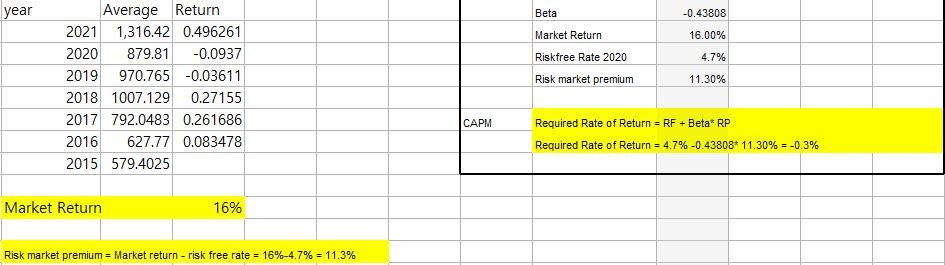
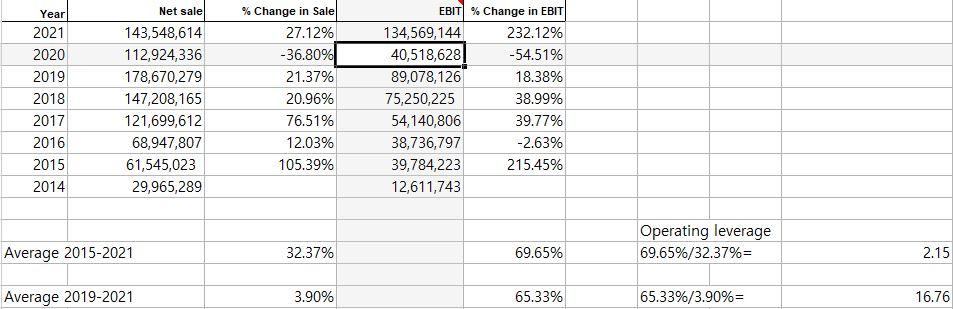
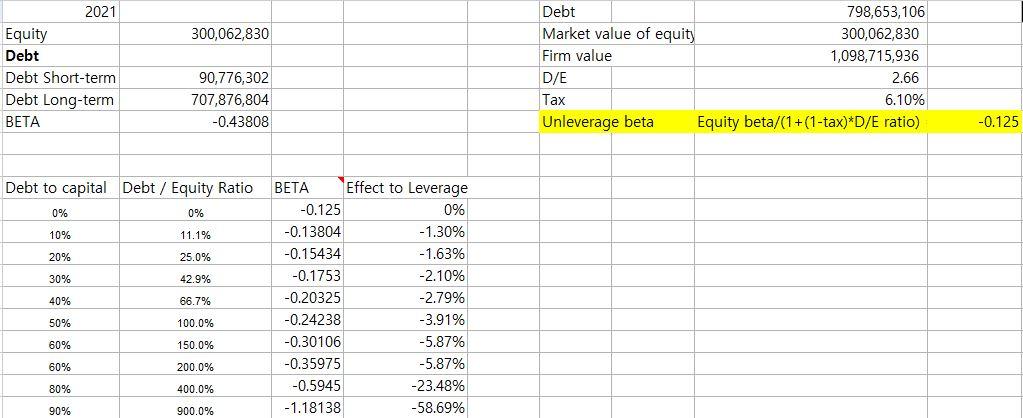
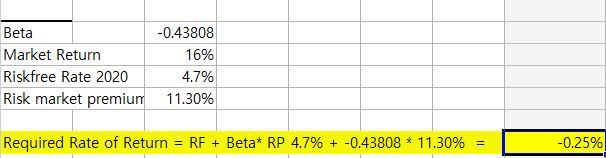
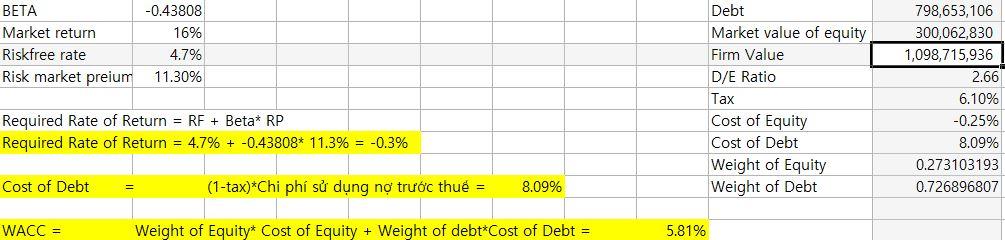
1. Equation BETA 2.SLOPE 3.Scatter Diagram COV(market,stock) -0.002129027 Var(market) 0.0048598781 -0.438082405 -0.438082405 TE: beta=-0.43808, c 1% thay i VNINDEX th TTE s thay i cng chiu -0.43808. TTE Scatter Diagram 1 0.8 0.6 0.4 . 0.2 . 0 -0.3 -0.25 -0.2 0.15 -0.1 -0.05 0 0.05 0.1 0.15 0.2 No. -0.2 -0.4 year Beta -0.43808 16.00% Market Return Riskfree Rate 2020 Risk market premium 4.7% Average Return 2021 1,316.42 0.496261 2020 879.81 -0.0937 2019 970.765 -0.03611 2018 1007.129 0.27155 2017 792.0483 0.261686 2016 627.77 0.083478 2015 579.4025 11.30% CAPM Required Rate of Return = RF + Beta* RP Required Rate of Return = 4.7% -0.43808* 11.30% = -0.3% Market Return 16% Risk market premium = Market return - risk free rate = 16%-4.7% = 11.3% Year 2021 2020 2019 2018 2017 2016 2015 2014 Net sale 143,548,614 112,924,336 178,670,279 147,208,165 121,699,612 68,947,807 61,545,023 29,965,289 % Change in Sale 27.12% -36.80% 21.37% 20.96% 76.51% 12.03% 105.39% EBIT % Change in EBIT 134,569,144 232.12% 40,518,628 -54.51% 89,078,126 18.38% 75,250,225 38.99% 54,140,806 39.77% 38,736,797 -2.63% 39,784,223 215.45% 12,611,743 Operating leverage 69.65%/32.37%= Average 2015-2021 32.37% 69.65% 2.15 Average 2019-2021 3.90% 65.33% 65.33%/3.90%= 16.76 300,062,830 2021 Equity Debt Debt Short-term Debt Long-term BETA Debt 798,653,106 Market value of equity 300,062,830 Firm value 1,098,715,936 D/E 2.66 Tax 6.10% Unleverage beta Equity beta/(1+(1-tax)*D/E ratio) 90,776,302 707,876,804 -0.43808 -0.125 Debt to capital Debt / Equity Ratio 0% 0% 10% 11.1% 20% 25.0% 30% 42.9% 40% 66.7% BETA Effect to Leverage -0.125 0% -0.13804 -1.30% -0.15434 -1.63% -0.1753 -2.10% -0.20325 -2.79% -0.24238 -3.91% -0.30106 -5.87% -0.35975 -5.87% -0.5945 -23.48% -1.18138 -58.69% 50% 100.0% 60% 150.0% 60% 200.0% 80% 400.0% 90% 900.0% Beta -0.43808 Market Return 16% Riskfree Rate 2020 4.7% Risk market premium 11.30% Required Rate of Return = RF + Beta* RP 4.7% + -0.43808 * 11.30% = -0.25% Cost of Debt (1-tax)*Chi ph s dng n trc thu 8.09% Debt Tax Interest expense Cost of debt before tax 798,653,106 6.10% 68,794,591 8.61% BETA Market return Riskfree rate Risk market preium -0.43808 16% 4.7% 11.30% Debt Market value of equity Firm Value D/E Ratio Tax Cost of Equity Cost of Debt Weight of Equity Weight of Debt 798,653,106 300,062,830 1,098,715,936 2.66 6.10% -0.25% 8.09% 0.273103193 0.726896807 Required Rate of Return = RF + Beta* RP Required Rate of Return = 4.7% + -0.43808* 11.3% = -0.3% Cost of Debt = (1-tax)*Chi ph s dng n trc thu = 8.09% WACC = Weight of Equity* Cost of Equity + Weight of debt*Cost of Debt = 5.81% BETA Market return Riskfree rate Risk market preium -0.43808 16% 4.7% 11.30% Debt Market value of equity Firm Value D/E Ratio Tax Cost of Equity Cost of Debt Weight of Equity Weight of Debt 798,653,106 300,062,830 1,098,715,936 2.66 6.10% -0.25% 8.09% 0.273103193 0.726896807 Required Rate of Return = RF + Beta* RP Required Rate of Return = 4.7% + -0.43808* 11.3% = -0.3% Cost of Debt (1-tax)*Chi ph s dng n trc thu = 8.09% WACC = Weight of Equity* Cost of Equity + Weight of debt Cost of Debt = 5.81% Beta -0.43808 Market capitalization Enterprise Value (EV) Market Return 16.00% Riskfree Rate 2020 4.7% 284,904,000 Market capitalization + Debt - Cash 1,025,077,832 (119,106,675.78) 2096 1,007,244,609 Risk market premium 11.30% FCF to firm Grow rate Firm value CAPM Required Rate of Return = RF + Beta RP Required Rate of Return = 4.7% -0.43808* 11.30% = -0.3% Debt Tax Interest expense Cost of debt before tax Cost of Debt 798,653,106 6.1096 68,794,591 8.6196 (1-tax*Chi ph s dng n trc thu 8.09% Debt Market value of equity Firm value D/E Tax Unleverage beta 798,653,106 300,062,830 1,098,715,936 2.66 6.10% Equity beta/(1+(1-tax)*D/E ratio) = -0.125 D/(D+E) E/(D+E) D/E Ratio 096 0% 10% 11.196 10096 90% 80% 7096 20% 25.0% 30% 42.9% 40% 6096 88.7% levered BETA Cost of Equity After-tax Cost of Debt Cost of Capital Firm's Value -0.125 3.2996 8.61% 3.2996 855216221 -0.139 3.139 9.31% 3.75% 879475808 -0.156 2.939 10.01% 4.35% 913248848 % -0.179 2.6896 10.71% 5.09% 958637184 -0.208 2.35% 11.41% 5.97% 1018840296 -0.25 1.8896 12.11% 6.999 1098812308 -0.313 1.17% 12.81% 8.15% 1206499902 -0.375 0.46% 13.51% 8.249 1215865345 -0.625 -2.3696 14.21% 10.90% 1569861178 -1.25 -9.4396 14.9196 12.4896 1899754249 5096 5096 100.0% 80% 4096 150.0% 8096 3096 200.0% 8096 2096 400.0% 9096 1096 900.0% 2021 2021 Price EBIT 134,569,144 21 13,566,857 Number of share Tax 6.1% 2021 EBIT(1-Tax) 126360426 2020 503,224,885 1,331,632,511 Gi tr hao mn ly k (*) Gi tr hao mn ly k (*) Gi tr hao mn ly k (*) 746,991,468 1,343,172,399 61,225,886 89,085,184 Depreciation and Amotization Capital expenditure Change non cash working capital FCF to the firm Debt 2020 2021 -119106675.8 798653106 58,479,274 Net working capital 966,336,838 -18,211,889,284 Cash Short-term assets 38,321,821,560 77,520,282,534 76,553,945,696 Short-term liabilities 56,533,710,844 Market capitalization 2020 2021 284,903,997.00 1,025,077,832.00 Enterprise Value (EV) Capital expenditures (fixed ass! 97.411.237.919 56,957,454,414 9 9 Firm value 20% 1,007,244,609.00
Step by Step Solution
There are 3 Steps involved in it

Get step-by-step solutions from verified subject matter experts