

Question: Between c or d Price AS Level P1 - - - P2 AD AD Y2 Y1 Real National Income 32) The graph above refers to
Between c or d
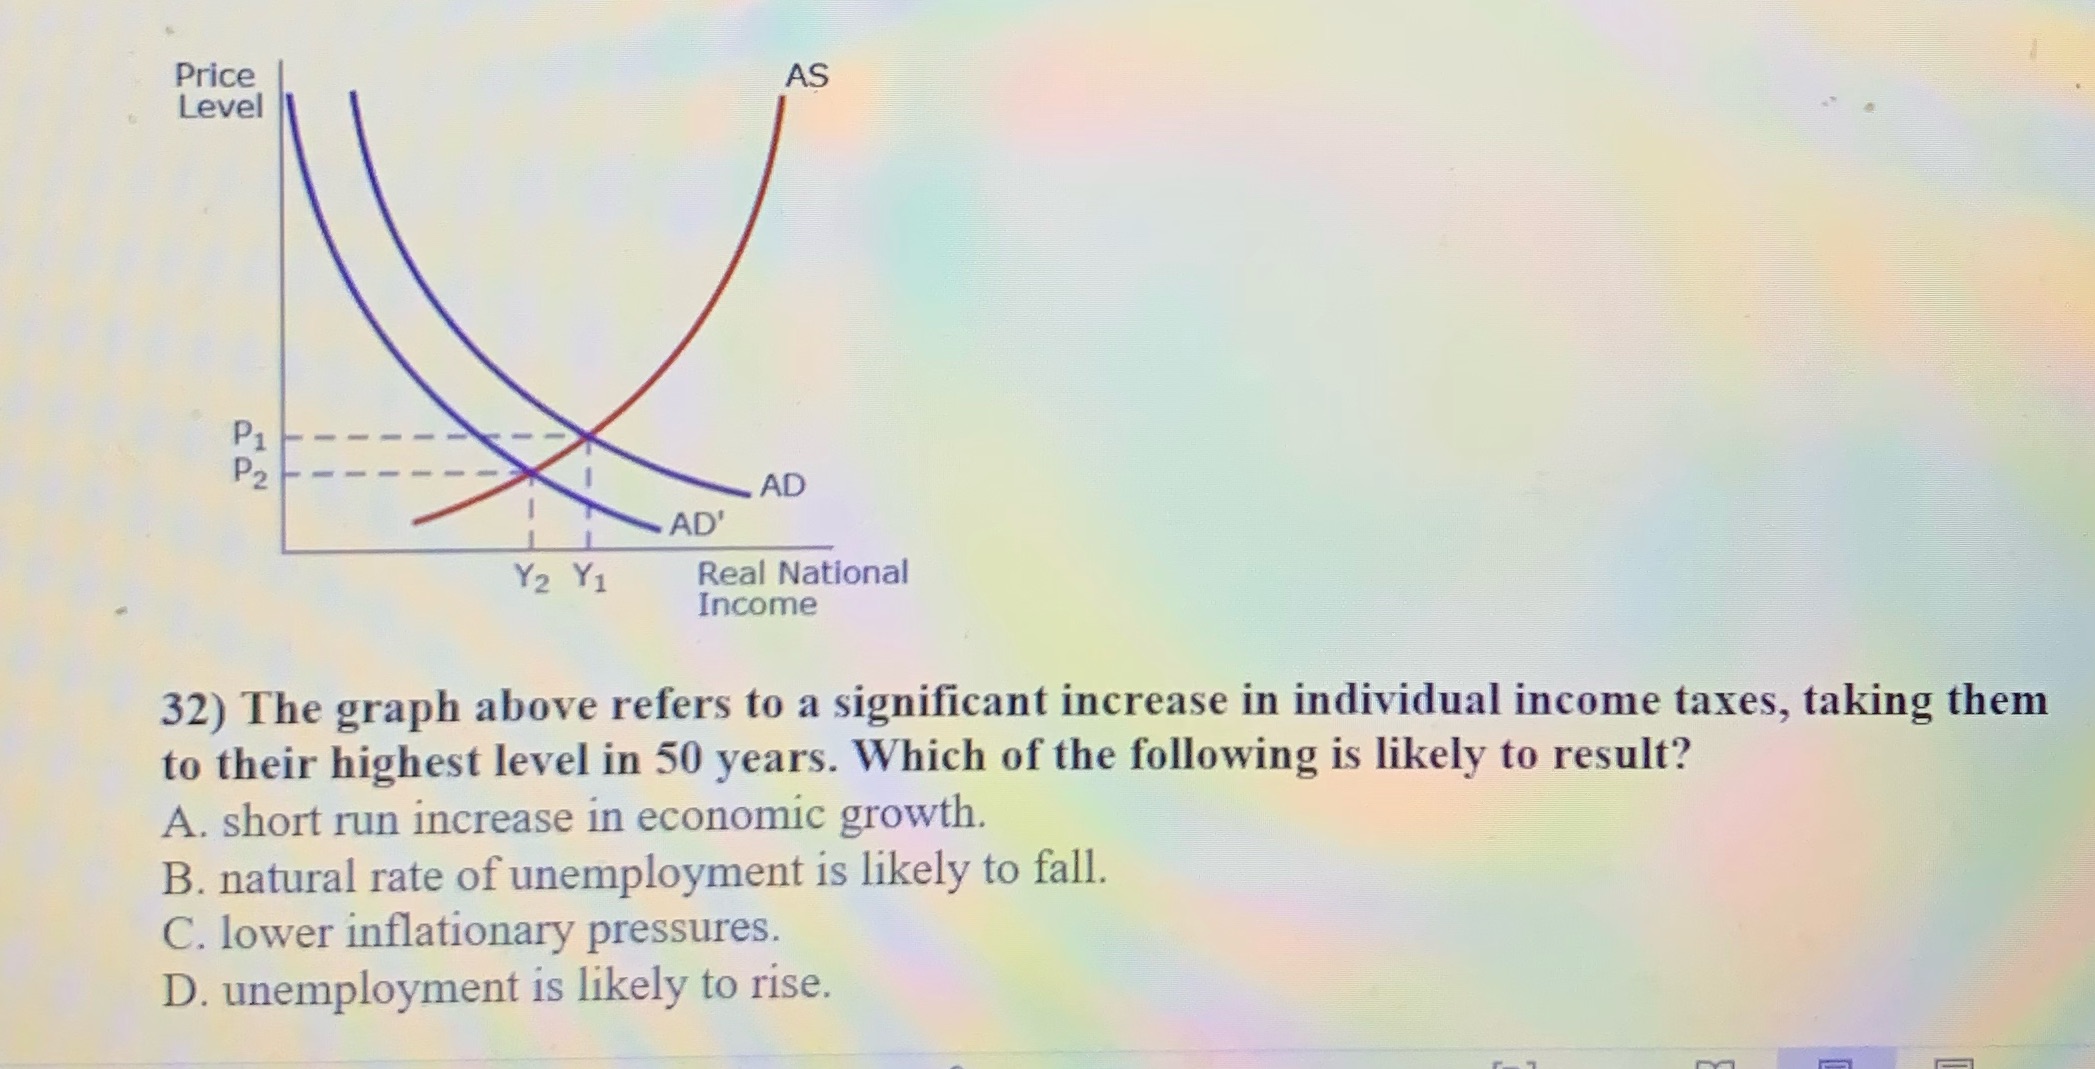
Price AS Level P1 - - - P2 AD AD Y2 Y1 Real National Income 32) The graph above refers to a significant increase in individual income taxes, taking them to their highest level in 50 years. Which of the following is likely to result? A. short run increase in economic growth. B. natural rate of unemployment is likely to fall. C. lower inflationary pressures. D. unemployment is likely to rise
Step by Step Solution
There are 3 Steps involved in it
1 Expert Approved Answer
Step: 1 Unlock

Question Has Been Solved by an Expert!
Get step-by-step solutions from verified subject matter experts
Step: 2 Unlock
Step: 3 Unlock