

Question: Big Data Analysis Academic Year 2 0 2 3 - 2 0 2 4 Excel Application 2 - PCA In 2 0 1 0 ,
Big Data Analysis
Academic Year
Excel Application PCA
In the New York Magazine published an article that discussed the most livable neighborhoods in New York. neighborhoods were evaluated based on variables, or broad categories:
Affordability as measured on a pricepersquarefoot basis, for both renters and buyers
Transit and proximity commute times to lower Manhattan and midtown, the density of subway coverage
Shopping and services the number of neighborhood amenities, especially supermarkets
Safety as measured by violent and nonviolentcrime rates
Food and restaurants judged by density and quality of options
Public schools test scores and parent satisfaction
Diversity in terms of both race and income
Creative capital arts venues as well as the number of residents engaged in the arts
Housing quality historic districts, code violations, cockroaches
Green space park and waterfront access, street trees
Wellness noise air quality, overall cleanliness
Bars and nightlife
Goal: The goal of this exercise is to understand how these different variables are related, and to better understand the similarities between all observations by making use of Principal Component Analysis.
Required filesdata see K:
The Excel macro: "pcamacro.xlsm
The Excel datafile: NYNeighborhoods.xlsx
Course slides
Step : Load data NY Neighborhoods into PCA macro pcamacro.xlsm
Open the NYNeighborhoods.xlsx dataset and the "pcamacro.xlsm file.
Copy the complete New York Neighborhoods dataset labels values into the "donnes tab in the PCA macro start pasting in cell B
If you have done this correctly, the nb lignes" variable should be equal to and the nb colonnes" variable should be equal to
We will now continue working with PCA macro.
Step : Interpreting the correlation matrix.
Go to the "varvp tab in the pcamacro.xlsm file.
The first matrix displayed in the "varvp tab is the correlation matrix. This matrix presents the correlation coefficients between the different variables. Each cell in the table shows the correlation between two variables.
Question : Why do we only find values on the diagonal of this matrix?
Question : What are the three largest positive or negative correlations apart from those on the diagonal Could you have predicted these relationships? Justify your answer.
Step : Eigenvectors and eigenvalues.
Go to the "varvp tab in the pcamacro.xlsm file.
As a result of the many variables in this dataset, it is difficult to grasp all relationships between the different variables by means of a correlation matrix. Therefore, we will now make use of a principal component analysis PCA to reduce the dimensionality of the data.
Below the correlation matrix displayed in the "varvp tab, the eigenvalues and eigenvectors are presented.
Question : What do the eigenvector and eigenvalues represent?
Question : How much of the variance in the original variables is explained by the first principal component? And by the second? And by the two first principal components together?
Question : Why does the first principal component always account for most of the total variance?
Question : How many principal components will we retain? On what does this depend?
Step : Analyzing the correlation circle monoplot
Go to the "cerclevariables" tab in the pcamacro.xlsm file and click on the tiquettes button.
In this tab you can find a correlation circle for the coefficients of the first two principal components ie axe and axe
Question : What does this correlation circle represent?
Question : Based on the correlation circle, which variables seem to influence the first principal component the most? Which variables seem to influence the second principal component the most?
Question : What can you say about neighborhoods that are positioned on the left of axis
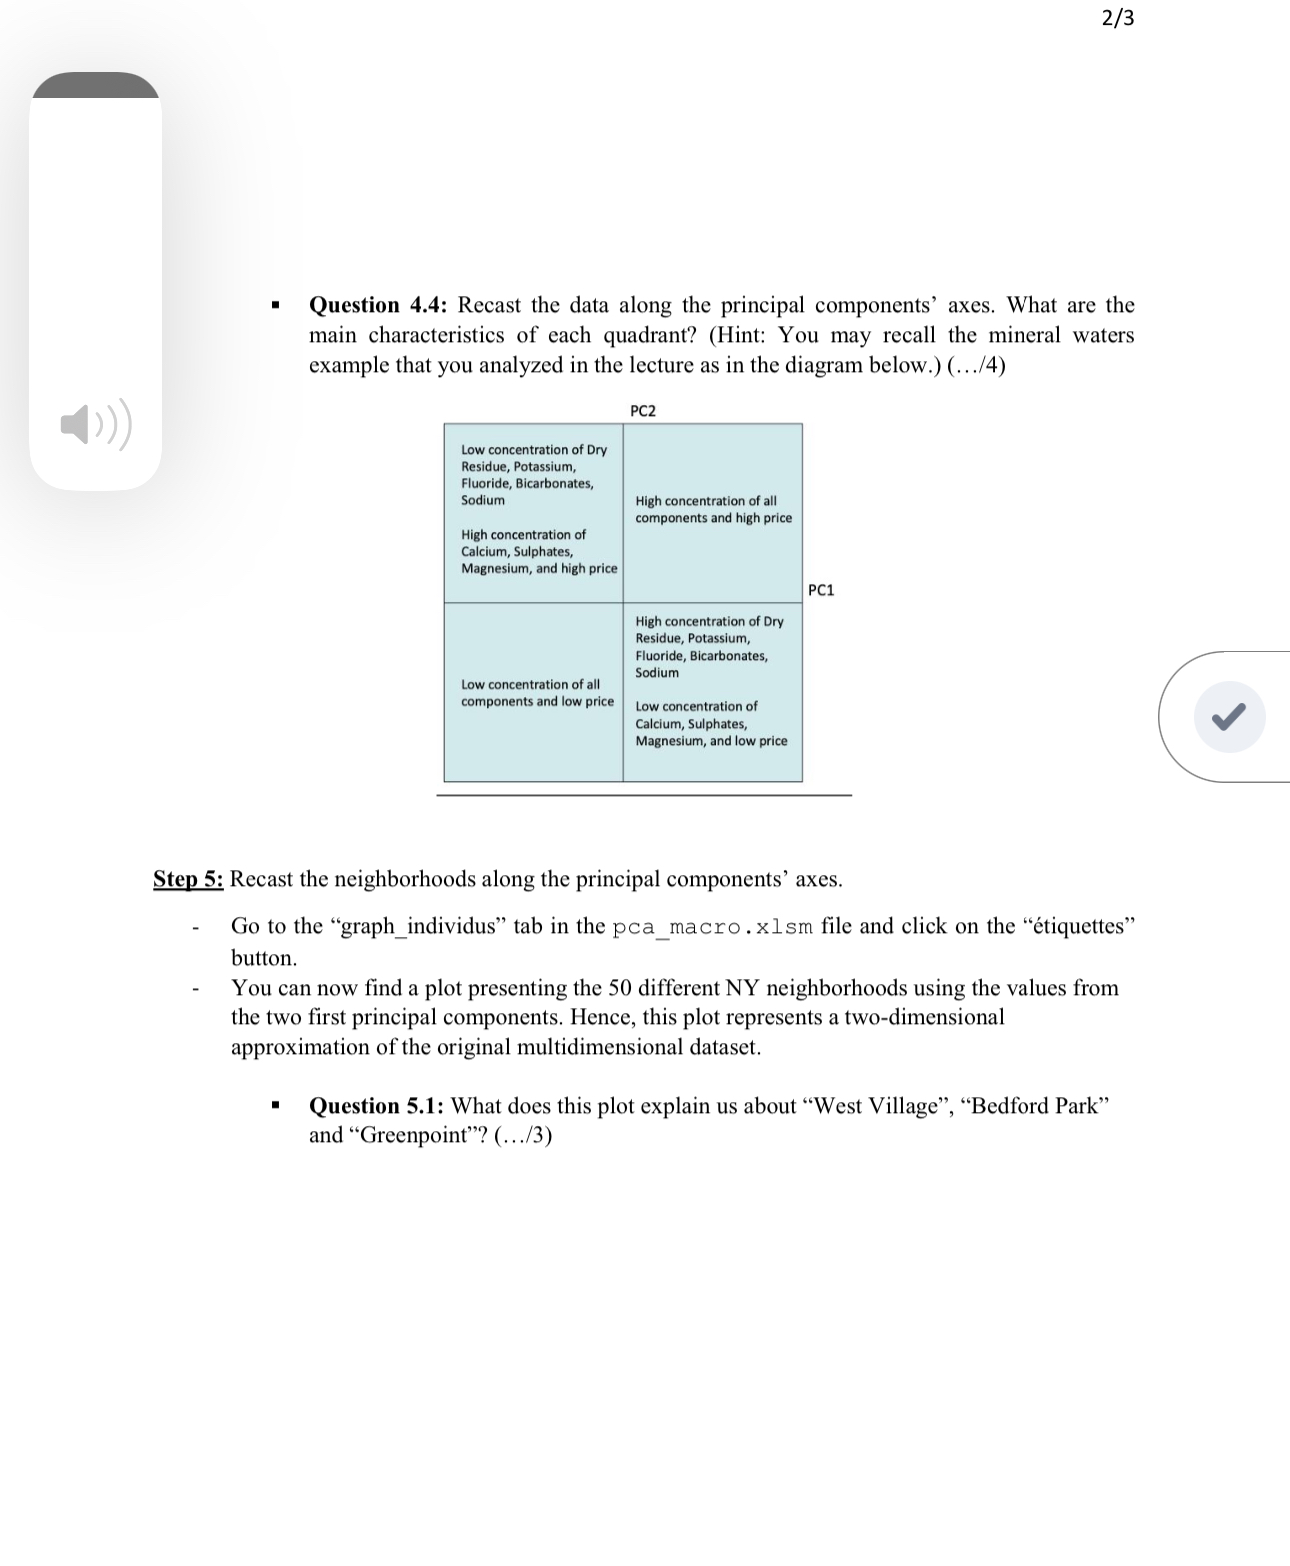
Question : Recast the data along the principal components' axes. What are the main characteristics of each quadrant? Hint: You may recall the mineral waters example that you analyzed in the lecture as in the diagram below.
tablePCtableLow concentration of DryResidue Potassium,Fluoride Bicarbonates,SodiumHigh concentration ofCalcium Sulphates,Magnesium and high pricetableHigh concentration of allcomponents and high pricetableLow concentration of allcomponents and low pricetableHigh concentration of DryResidue Potassium,Fluoride Bicarbonates,SodiumLow concentration o
Step by Step Solution
There are 3 Steps involved in it
1 Expert Approved Answer
Step: 1 Unlock

Question Has Been Solved by an Expert!
Get step-by-step solutions from verified subject matter experts
Step: 2 Unlock
Step: 3 Unlock