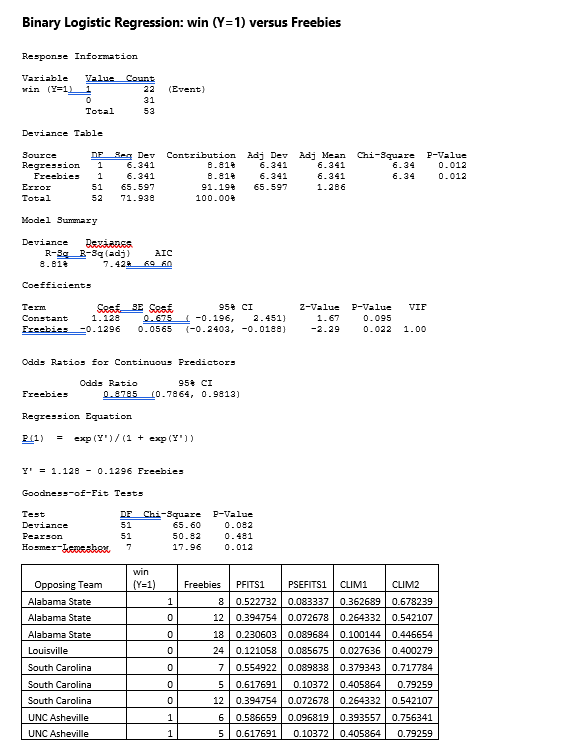
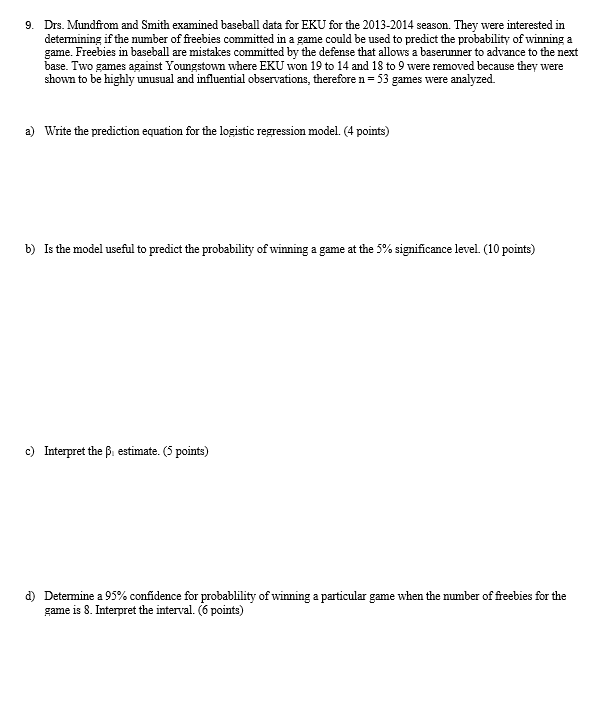
Question: Binary Logistic Regression: win (Y=1) versus Freebies Response Information Variable Value Count win (Y=1) 22 (Event] 31 Total Deviance Table Source DE Ben Dev Contribution

Binary Logistic Regression: win (Y=1) versusBinary Logistic Regression: win (Y=1) versusBinary Logistic Regression: win (Y=1) versus
Binary Logistic Regression: win (Y=1) versus Freebies Response Information Variable Value Count win (Y=1) 22 (Event] 31 Total Deviance Table Source DE Ben Dev Contribution Adj Dev Adj Mean Chi-Square P-Value Regression 1 6.341 8.819 6.341 6. 341 6.34 0 . 012 Freebies 1 6.341 6.341 6.341 6.34 0 . 012 51 65.597 91.198 65 . 597 1.286 Total 52 71.938 100 .009 Model Summary Deviance R-5q B-3q (adj) AIC 7. 428 69 60 Coefficients Term Cost SE CARE 950 CI 2-Value P-Value VIF Constant 1. 123 0. 675 -0.196, 2 . 451] 1. 67 0.095 -0. 1296 0. 0565 (-0. 2403, -0. 0188) -2.29 0. 022 1.00 Odds Ratios for Continuous Predictors Odds Ratio 958 CI Freebies 0.8785 (0.7864, 0.9813) Regression Equation Bil) = exp (Y' ) / (1 + exp (Y') ) Y' = 1.128 - 0.1296 Freebies Goodness-of-Fit Tests Test DE Chi-Square P-Value Deviance 51 65 . 60 0 . 082 Pearson 51 50 .82 0 . 481 Hosmer HEDGEROW 17.96 0 . 012 win Opposing Team (Y=1) Freebies PFITS1 PSEFITS1 CLIM1 CLIM2 =geng Blueqely 1 8 0.522732 0.083337 0.362689 0.678239 Alabama State 0 12 0.394754 0.072678 0.264332 0.542107 Alabama State 0 18 0.230603 0.089684 0.100144 0.446654 Louisville 0 24 0.121058 0.085675 0.027636 0.400279 South Carolina 0 7 0.554922 0.089838 0.379343 0.717784 South Carolina 0 5 0.617691 0.10372 0.405864 0.79259 South Carolina 0 12 0.394754 0.072678 0.264332 0.542107 UNC Asheville 1 6 0.586659 0.096819 0.393557 0.756341 UNC Asheville 1 5 0.617691 0.10372 0 405864 0.79259\f9. Drs. Mundfrom and Smith examined baseball data for EKU for the 2013-2014 season. They were interested in determining if the number of freebies committed in a game could be used to predict the probability of winning a game. Freebies in baseball are mistakes committed by the defense that allows a baserunner to advance to the next base. Two games against Youngstown where EKU won 19 to 14 and 18 to 9 were removed because they were shown to be highly unusual and influential observations, therefore n = 53 games were analyzed. a) Write the prediction equation for the logistic regression model. (4 points) b) Is the model useful to predict the probability of winning a game at the 5% significance level. (10 points) c) Interpret the P estimate. (5 points) d) Determine a 95% confidence for probably of winning a particular game when the number of freebies for the game is 8. Interpret the interval. (6 points)

Step by Step Solution

There are 3 Steps involved in it

1 Expert Approved Answer
Step: 1 Unlock blur-text-image
Question Has Been Solved by an Expert!

Get step-by-step solutions from verified subject matter experts

Step: 2 Unlock
Step: 3 Unlock

Students Have Also Explored These Related Mathematics Questions!