

Question: bissiness analytics and decision making plz do it fast What does the following table represent? What is your analysis and conclusion? Please make sure that
bissiness analytics and decision making 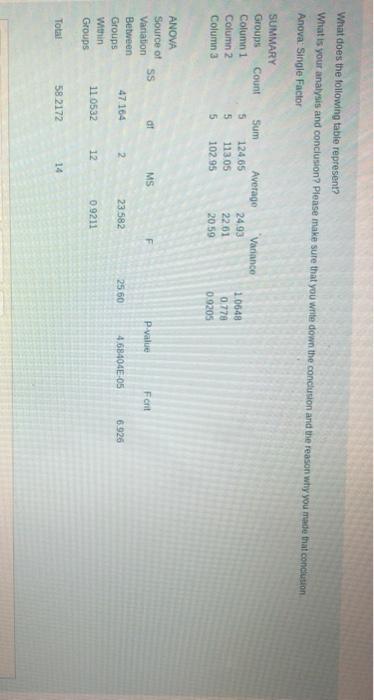
What does the following table represent? What is your analysis and conclusion? Please make sure that you write down the conclusion and the reason why you made that conclusion Anova: Single Factor SUMMARY Groups Count Column 1 Column 2 Column 3 Sum Average Variance 5 124.65 2493 5 11305 2201 5 102.95 20.59 1.0648 0.778 09205 SS of MS F P-value Font ANOVA Source of Variation Between Groups Within Groups 47 164 2 23582 25 50 4,68404E-05 6.926 11 0532 12 0.9211 Total 58 2172 14
plz do it fast
Step by Step Solution
There are 3 Steps involved in it
1 Expert Approved Answer
Step: 1 Unlock

Question Has Been Solved by an Expert!
Get step-by-step solutions from verified subject matter experts
Step: 2 Unlock
Step: 3 Unlock