

Question: BIU. .0.A. S E E Merge & Center. $. % , 8-88 Insert Delete Format Conditional Format as Cell Formatting Table Styles Styles 0 Clear
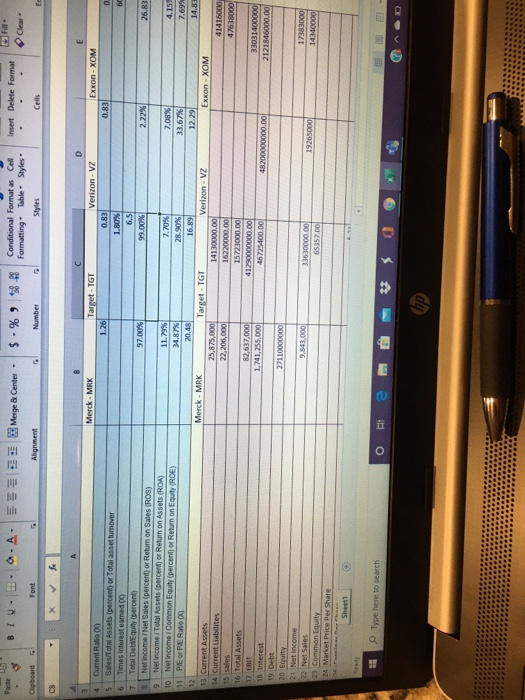
BIU. .0.A. S E E Merge & Center. $. % , 8-88 Insert Delete Format Conditional Format as Cell Formatting Table Styles Styles 0 Clear Font Alignment E Merck - MRK Target - TGT Verizon - VZ Exxon - XOM 1.26 0.83 0.83 0 L.BOX 6.5 97.00% 5 Sales/Total Assets (percent of Total asset turnover 6 Times interest eamed og 7 Total Debt Equity percent) Net Income I Net Sales (percent) or Return on Sales (ROS) 9 Net Income Total Assets percent) or Return on Assets (ROA) 10 Net Income Common Equity (percent of Return on Equity (ROE) 111 PE O PER 09 99.00 2.22% 26.83 13 Current Assets 14 Current Liabilites 7.70% 7.08% 4.15% 34.87% 28.90% 7.69% 20,48 16.89 12.29 14.83 Merck - MRK Target - TGT Verizon - VZ Exxon - XOM 25,875,000 14130000.00 41416000 22,206,000 16220000.00 47638000 15723000.00 82,637,000 41230000000.00 33031400000 1.741.255.oool 46725400.00 48200000000.00 2121846000.00 15 sales 16 Total Assets 17 FRIT 18 Interest 20 Equity 21 Net Income 22 Net Sales 23 Common Equity 24 Market Price Per Share 33630000.00 19265000 17383000 14340000 Sheet1 Type here to search BIU. .0.A. S E E Merge & Center. $. % , 8-88 Insert Delete Format Conditional Format as Cell Formatting Table Styles Styles 0 Clear Font Alignment E Merck - MRK Target - TGT Verizon - VZ Exxon - XOM 1.26 0.83 0.83 0 L.BOX 6.5 97.00% 5 Sales/Total Assets (percent of Total asset turnover 6 Times interest eamed og 7 Total Debt Equity percent) Net Income I Net Sales (percent) or Return on Sales (ROS) 9 Net Income Total Assets percent) or Return on Assets (ROA) 10 Net Income Common Equity (percent of Return on Equity (ROE) 111 PE O PER 09 99.00 2.22% 26.83 13 Current Assets 14 Current Liabilites 7.70% 7.08% 4.15% 34.87% 28.90% 7.69% 20,48 16.89 12.29 14.83 Merck - MRK Target - TGT Verizon - VZ Exxon - XOM 25,875,000 14130000.00 41416000 22,206,000 16220000.00 47638000 15723000.00 82,637,000 41230000000.00 33031400000 1.741.255.oool 46725400.00 48200000000.00 2121846000.00 15 sales 16 Total Assets 17 FRIT 18 Interest 20 Equity 21 Net Income 22 Net Sales 23 Common Equity 24 Market Price Per Share 33630000.00 19265000 17383000 14340000 Sheet1 Type here to search
Step by Step Solution
There are 3 Steps involved in it

Get step-by-step solutions from verified subject matter experts