

Question: BIUA.A. HE Problem 1: Use the following data for problem 1. Input Output 4 8 5 10 9 8 12 1.a Make a scatter plot
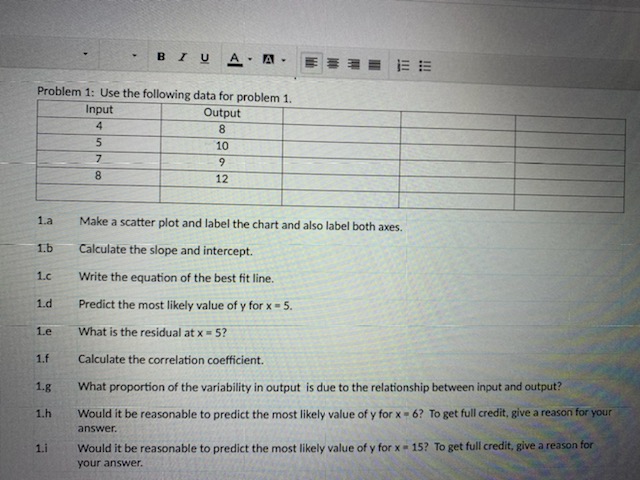
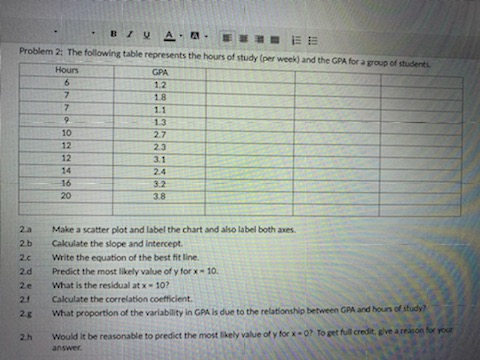
BIUA.A. HE Problem 1: Use the following data for problem 1. Input Output 4 8 5 10 9 8 12 1.a Make a scatter plot and label the chart and also label both axes. 1.b Calculate the slope and intercept. 1.c Write the equation of the best fit line. 1.d Predict the most likely value of y for x - 5. Le What is the residual at x = 5? 1.f Calculate the correlation coefficient. What proportion of the variability in output is due to the relationship between input and output? 1.h Would it be reasonable to predict the most likely value of y for x - 6? To get full credit, give a reason for your answer. 1.i Would it be reasonable to predict the most likely value of y for x - 15? To get full credit, give a reason for your answer.A . . EE Problem 2: The following table represents the hours of study (per week) and the GPA for a group of students. Hours GPA 12 1.1 1.3 10 2.7 12 2.3 12 3.1 14 2.4 16 3.2 20 3.8 Make a scatter plot and label the chart and also label both mom 2b Calculate the slope and Intercept Write the equation of the best fit line. 2.d Predict the most likely value of y for x - 10. What is the residual at x = 10? 21 Calculate the correlation coefficient. What proportion of the variability in GPA Is due to the relationship between GPA and hour of study? 2.h Would It be reasonable to predict the most likely value of y for * = 0? To get full credit, give a reason for your
Step by Step Solution
There are 3 Steps involved in it

Get step-by-step solutions from verified subject matter experts