

Question: Bivariate data obtained for the paired variables x and y are shown below, in the table labelled Sample data. These data are plotted in the
Bivariate data obtained for the paired variables x and y are shown below, in the table labelled "Sample data." These data are plotted in the scatter plot in Figure 1, which also displays the least-squares regression line for the data. The equation for this line is
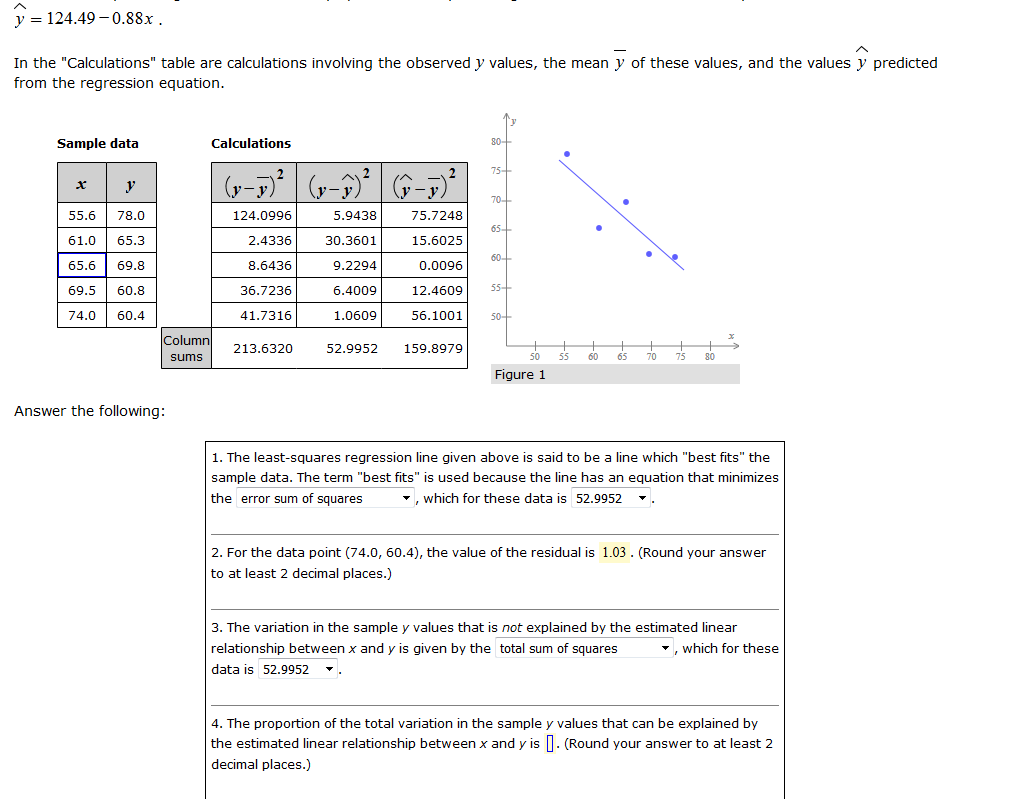
A y =124.490.88x . _ A In the "Calculations\" table are calculations involving the observed y va ues, the mean y of these values, and the values y predicted from the regression equation. A]: Sample data Calculations W . Z A 2- A _ 2 T5 (JrE) (yy) (9"!) .0 , 124.0996 5.9438 ?5.?248 65 0 2.4336 30.3601 15.6025 I 8.6436 9.2294 0.0096 60 36.7236 6.4009 12.4609 55 41.?316 1.0609 56.1001 50 X l l l | l l | 3- 213.6320 52.9952 159.89?9 so 55 an 65 m 15 m Figure 1 Answer the following: 1. The leastsquares regression line given above is said to be a line which "best ts" the sample data. The term "best ts" is used because the line has an equation that minimizes the error sum of squares V , which for these data is 52.9952 V . 2. For the data point (?4.0. 60.4). the value of the residual is 1.03 . (Round your answer to at least 2 decimal places.) 3. The variation in the sample it values that is not explained by the estimated linear relationship between x and y is given by the total sum of squares V , which for these data is 52.9952 V . 4. The proportion of the total variation in the sample y values that can be explained by the estimated linear relationship between X and y is I]. (Round your answer to at least 2 decimal places.)
Step by Step Solution
There are 3 Steps involved in it

Get step-by-step solutions from verified subject matter experts