

Question: Blooper's analysts have come up with the following revised estimates for its magnoosium mine: Initial Investment Revenues Variable costs Fixed cost Working capital Range Pessimistie
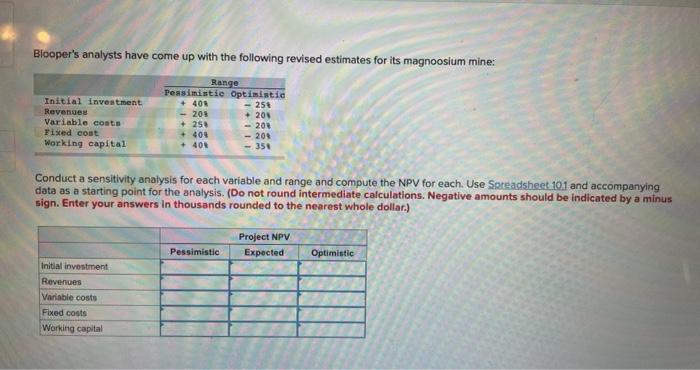
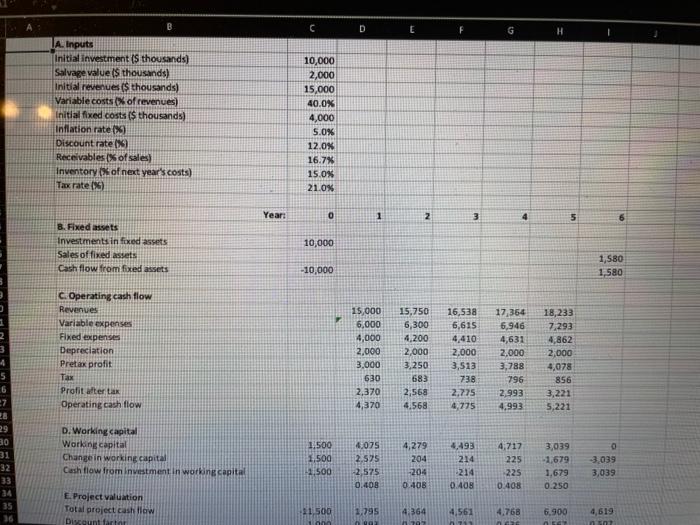
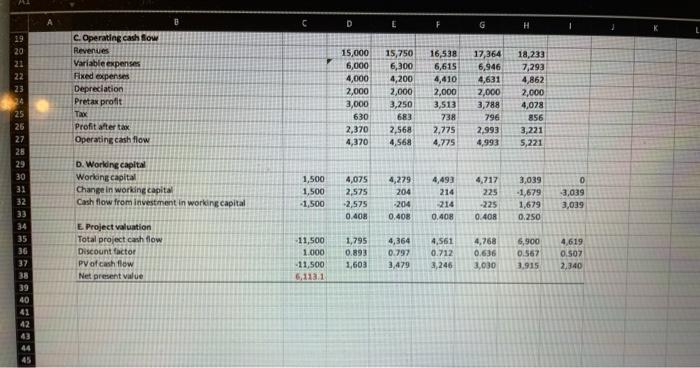
Blooper's analysts have come up with the following revised estimates for its magnoosium mine: Initial Investment Revenues Variable costs Fixed cost Working capital Range Pessimistie Optimistic + 401 - 25$ - 205 201 + 250 - 208 + 408 205 + 401 350 Conduct a sensitivity analysis for each variable and range and compute the NPV for each. Use Spreadsheet 101 and accompanying data as a starting point for the analysis. (Do not round intermediate calculations. Negative amounts should be indicated by a minus sign. Enter your answers in thousands rounded to the nearest whole dollar) Project NPV Expected Pessimistic Optimistic Initial investment Revenues Variable costs Fixed costs Working capital D E G H A. Inputs Initial investment is thousands) Salvage values thousands) Initial revenues as thousands) Variable costs of revenues) Initial fixed costs ($thousands) Inflation rate) Discount rate() Receivables % of sales Inventory of next year's costs) Tax rate(%) 10,000 2,000 15,000 40.0% 4,000 5.0% 12.08 16.7% 15.0% 21.0% Year 0 1 1 2 4 5 8. Fixed assets Investments in fixed assis Sales of fixed assets Cash flow from fixed assets 10,000 -10,000 1,580 1,580 C. Operating cash flow Revenues Variable expenses Fixed expenses Depreciation Pretax profit Tax Profit altera Operating cash flow 15,000 6,000 4,000 2.000 3,000 630 2,370 4,370 15,750 6,300 4,200 2.000 3,250 683 2,568 4.568 16,538 6,615 4,410 2.000 3,513 738 2.775 4,775 17,364 6,946 4,631 2.000 3,788 796 2,993 4.993 18,233 7,293 4,862 2,000 4,078 856 3,221 5,221 2 3 4 5 6 07 28 29 30 31 32 33 34 0 D. Working capital Working capital Change in working capital Cash flow from investment in worlung capital 1.500 1,500 1500 4.075 2.575 -2.575 0.408 4,279 204 204 0.40B 4,493 214 214 0.408 4,717 225 225 0.408 3,039 1,679 1.679 0.250 3,039 3,039 E. Project Valuation Total project cash flow Discount 31500 1.795 4364 79 4,561 4.768 6.900 4,619 D E F G H 1 C. Operating cash flow Revenues Variable expenses Fixed expenses Depreciation Pretax profit Tax Profit after tax Operating cash flow 15,000 6,000 4,000 2,000 3,000 630 2,370 4,370 15,750 6,300 4,200 2,000 3,250 683 2,568 4,568 16,538 6,615 4,410 2,000 3,513 738 2.775 4,775 17,364 6,946 4,631 2,000 3,788 796 2.993 4,993 18,233 7,293 4,862 2,000 4,078 856 3,221 5,221 19 20 21 22 23 94 25 26 27 28 29 30 31 32 33 34 35 36 37 38 39 40 D. Worldng capital Working capital Change in working capital Cash flow from investment in working capital 1,500 1,500 1,500 4,075 2,575 -2,575 0.408 4,279 204 -204 0.408 4,493 214 214 0.408 4,717 225 -225 0.408 3,039 -1.679 1,679 0.250 0 3,039 3,039 E. Project valuation Total project cash flow Discount factor PV of cash flow Net present value -11,500 1.000 -11,500 6,1131 1,795 0.893 1,603 4,364 0.797 3,479 4,561 0.712 3,246 4,768 0.636 3.030 6,900 0.567 3.915 4,619 0.507 2,340 41 42 43 45 Blooper's analysts have come up with the following revised estimates for its magnoosium mine: Initial Investment Revenues Variable costs Fixed cost Working capital Range Pessimistie Optimistic + 401 - 25$ - 205 201 + 250 - 208 + 408 205 + 401 350 Conduct a sensitivity analysis for each variable and range and compute the NPV for each. Use Spreadsheet 101 and accompanying data as a starting point for the analysis. (Do not round intermediate calculations. Negative amounts should be indicated by a minus sign. Enter your answers in thousands rounded to the nearest whole dollar) Project NPV Expected Pessimistic Optimistic Initial investment Revenues Variable costs Fixed costs Working capital D E G H A. Inputs Initial investment is thousands) Salvage values thousands) Initial revenues as thousands) Variable costs of revenues) Initial fixed costs ($thousands) Inflation rate) Discount rate() Receivables % of sales Inventory of next year's costs) Tax rate(%) 10,000 2,000 15,000 40.0% 4,000 5.0% 12.08 16.7% 15.0% 21.0% Year 0 1 1 2 4 5 8. Fixed assets Investments in fixed assis Sales of fixed assets Cash flow from fixed assets 10,000 -10,000 1,580 1,580 C. Operating cash flow Revenues Variable expenses Fixed expenses Depreciation Pretax profit Tax Profit altera Operating cash flow 15,000 6,000 4,000 2.000 3,000 630 2,370 4,370 15,750 6,300 4,200 2.000 3,250 683 2,568 4.568 16,538 6,615 4,410 2.000 3,513 738 2.775 4,775 17,364 6,946 4,631 2.000 3,788 796 2,993 4.993 18,233 7,293 4,862 2,000 4,078 856 3,221 5,221 2 3 4 5 6 07 28 29 30 31 32 33 34 0 D. Working capital Working capital Change in working capital Cash flow from investment in worlung capital 1.500 1,500 1500 4.075 2.575 -2.575 0.408 4,279 204 204 0.40B 4,493 214 214 0.408 4,717 225 225 0.408 3,039 1,679 1.679 0.250 3,039 3,039 E. Project Valuation Total project cash flow Discount 31500 1.795 4364 79 4,561 4.768 6.900 4,619 D E F G H 1 C. Operating cash flow Revenues Variable expenses Fixed expenses Depreciation Pretax profit Tax Profit after tax Operating cash flow 15,000 6,000 4,000 2,000 3,000 630 2,370 4,370 15,750 6,300 4,200 2,000 3,250 683 2,568 4,568 16,538 6,615 4,410 2,000 3,513 738 2.775 4,775 17,364 6,946 4,631 2,000 3,788 796 2.993 4,993 18,233 7,293 4,862 2,000 4,078 856 3,221 5,221 19 20 21 22 23 94 25 26 27 28 29 30 31 32 33 34 35 36 37 38 39 40 D. Worldng capital Working capital Change in working capital Cash flow from investment in working capital 1,500 1,500 1,500 4,075 2,575 -2,575 0.408 4,279 204 -204 0.408 4,493 214 214 0.408 4,717 225 -225 0.408 3,039 -1.679 1,679 0.250 0 3,039 3,039 E. Project valuation Total project cash flow Discount factor PV of cash flow Net present value -11,500 1.000 -11,500 6,1131 1,795 0.893 1,603 4,364 0.797 3,479 4,561 0.712 3,246 4,768 0.636 3.030 6,900 0.567 3.915 4,619 0.507 2,340 41 42 43 45
Step by Step Solution
There are 3 Steps involved in it

Get step-by-step solutions from verified subject matter experts