

Question: Blowing bubbles Inc. produces multicolored bubble solution used for weddings and other events. Blowing bubbles plant capacity is 52,500 kits. If actual volume exceeds 52,500
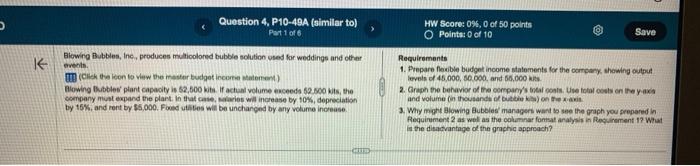
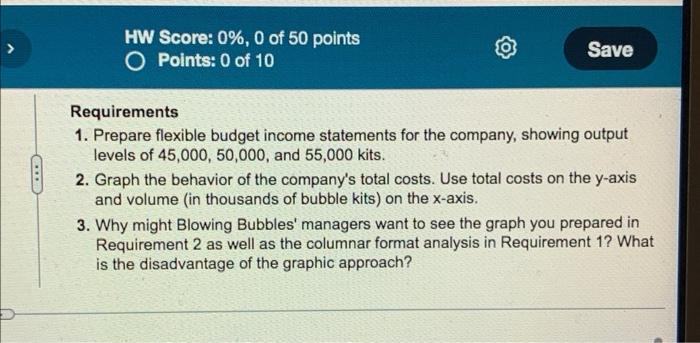
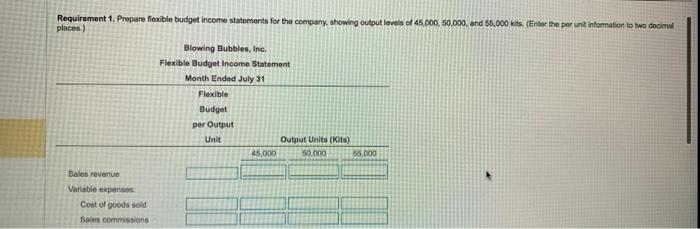
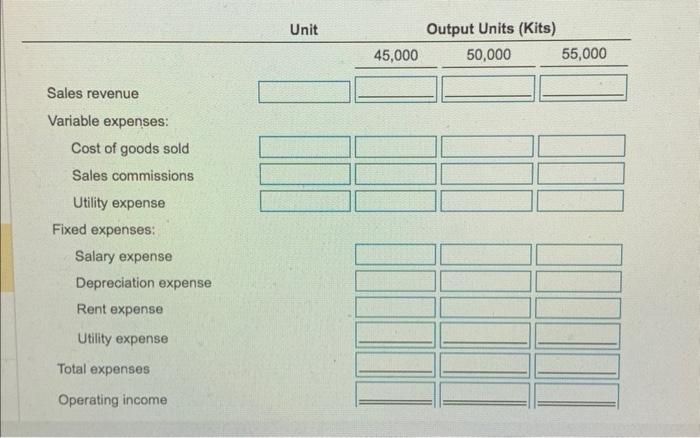
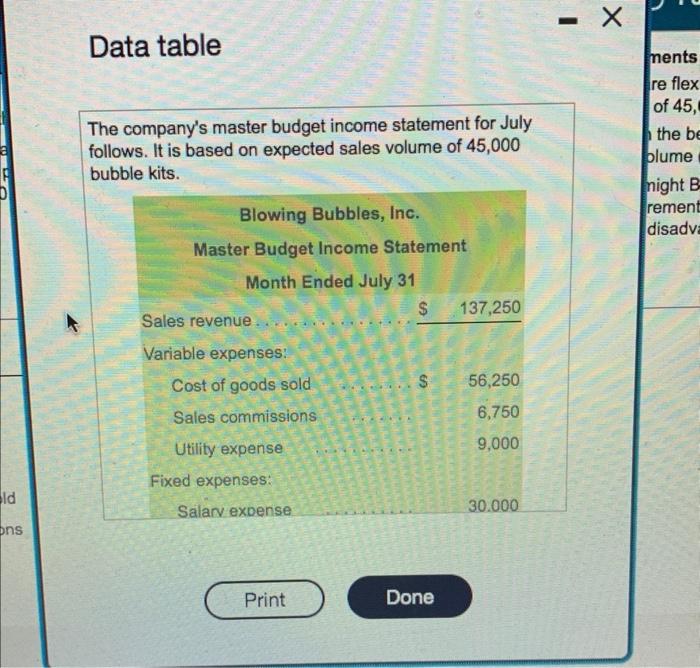
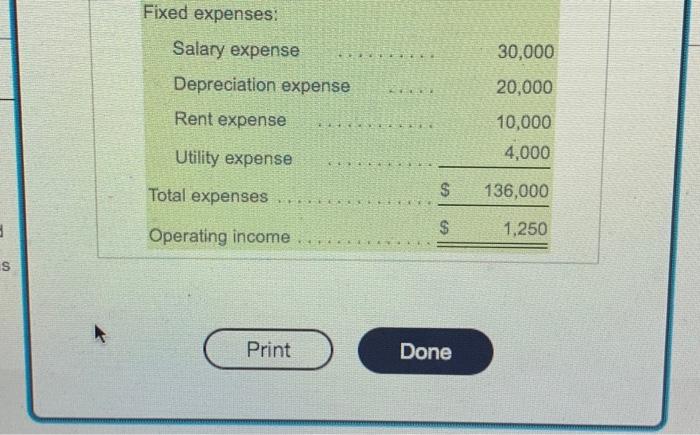
Requirements 1. Prepare flexible budget income statements for the company, showing output levels of 45,000,50,000, and 55,000 kits. 2. Graph the behavior of the company's total costs. Use total costs on the y-axis and volume (in thousands of bubble kits) on the x-axis. 3. Why might Blowing Bubbles' managers want to see the graph you prepared in Requirement 2 as well as the columnar format analysis in Requirement 1 ? What is the disadvantage of the graphic approach? Requirement 1. Prepare fesible budget ineome statements for the compuny, showing output levels of 45,000,50,000, and 55,000 kits, (Einter the per unit intormation to two dooimel places.) Variable expenses: Cost of goods sold Sales commissions Utility expense Fixed expenses: Salary expense Depreciation expense Rent expense Utility expense Total expenses Operating income Data table The company's master budget income statement for July follows. It is based on expected sales volume of 45,000 bubble kits. Fixed expenses: Print Done
Step by Step Solution
There are 3 Steps involved in it

Get step-by-step solutions from verified subject matter experts