

Question: Blue Mountain Mining Ltd is evaluating its proposed iron ore mine for the Pilbara region of West Australia. The mines primary operations are the extraction
Blue Mountain Mining Ltd is evaluating its proposed iron ore mine for the Pilbara region of West Australia. The mines primary operations are the extraction of iron ore and its transportation to the port. Given that the mine is 240 kilometres to the nearest port, ore will be transported using three (3) heavy haul trains where each train comprises two (2) locomotives and 208 ore carriages. It is anticipated that it will take one day for each train to complete the return trip from the mine to the port, including loading and unloading
The management of Blue Mountain Mining Ltd have requested that you provide a detailed financial analysis of each train option and prepare a report that recommends a preferred option. Using the information below create a Discounted Cash Flow Analysis and calculate the NPV over 30 years:
The following information has been provided:
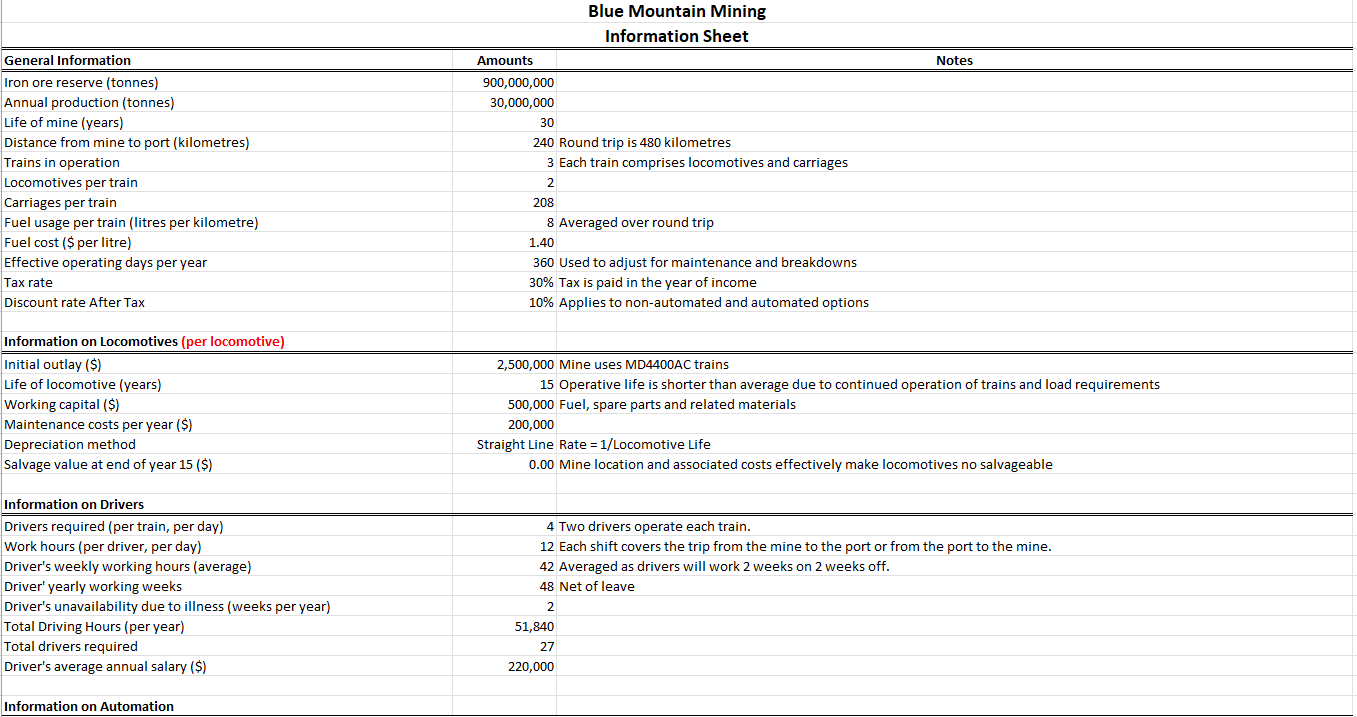
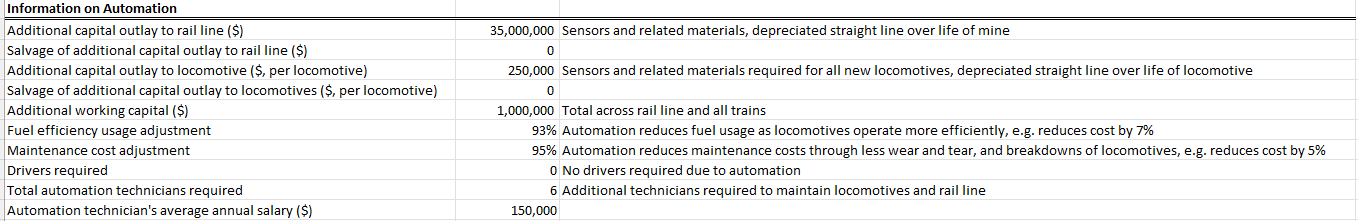
General Information Iron ore reserve (tonnes) Annual production (tonnes) Life of mine (years) Distance from mine to port (kilometres) Trains in operation Locomotives per train Carriages per train Fuel usage per train (litres per kilometre) Fuel cost ($ per litre) Effective operating days per year Tax rate Discount rate After Tax Information on Locomotives (per locomotive) Initial outlay ($) Life of locomotive (years) Working capital ($) Maintenance costs per year ($) Depreciation method Salvage value at end of year 15 ($) Information on Drivers Drivers required (per train, per day) Work hours (per driver, per day) Driver's weekly working hours (average) Driver' yearly working weeks Driver's unavailability due to illness (weeks per year) Total Driving Hours (per year) Total drivers required Driver's average annual salary ($) Information on Automation Blue Mountain Mining Information Sheet Amounts 900,000,000 30,000,000 30 240 Round trip is 480 kilometres 3 Each train comprises locomotives and carriages 2 208 8 Averaged over round trip 1.40 360 Used to adjust for maintenance and breakdowns 30% Tax is paid in the year of income 10% Applies to non-automated and automated options 2,500,000 Mine uses MD4400AC trains 15 Operative life is shorter than average due to continued operation of trains and load requirements 500,000 Fuel, spare parts and related materials 200,000 Straight Line Rate = 1/Locomotive Life 0.00 Mine location and associated costs effectively make locomotives no salvageable 4 Two drivers operate each train. 12 Each shift covers the trip from the mine to the port or from the port to the mine. 42 Averaged as drivers will work 2 weeks on 2 weeks off. 48 Net of leave 2 51,840 27 220,000 Notes Information on Automation Additional capital outlay to rail line ($) Salvage of additional capital outlay to rail line ($) Additional capital outlay to locomotive ($, per locomotive) Salvage of additional capital outlay to locomotives ($, per locomotive) Additional working capital ($) Fuel efficiency usage adjustment Maintenance cost adjustment Drivers required Total automation technicians required Automation technician's average annual salary ($) 35,000,000 Sensors and related materials, depreciated straight line over life of mine 0 250,000 Sensors and related materials required for all new locomotives, depreciated straight line over life of locomotive 0 1,000,000 Total across rail line and all trains 93% Automation reduces fuel usage as locomotives operate more efficiently, e.g. reduces cost by 7% 95% Automation reduces maintenance costs through less wear and tear, and breakdowns of locomotives, e.g. reduces cost by 5% 0 No drivers required due to automation 6 Additional technicians required to maintain locomotives and rail line 150,000 General Information Iron ore reserve (tonnes) Annual production (tonnes) Life of mine (years) Distance from mine to port (kilometres) Trains in operation Locomotives per train Carriages per train Fuel usage per train (litres per kilometre) Fuel cost ($ per litre) Effective operating days per year Tax rate Discount rate After Tax Information on Locomotives (per locomotive) Initial outlay ($) Life of locomotive (years) Working capital ($) Maintenance costs per year ($) Depreciation method Salvage value at end of year 15 ($) Information on Drivers Drivers required (per train, per day) Work hours (per driver, per day) Driver's weekly working hours (average) Driver' yearly working weeks Driver's unavailability due to illness (weeks per year) Total Driving Hours (per year) Total drivers required Driver's average annual salary ($) Information on Automation Blue Mountain Mining Information Sheet Amounts 900,000,000 30,000,000 30 240 Round trip is 480 kilometres 3 Each train comprises locomotives and carriages 2 208 8 Averaged over round trip 1.40 360 Used to adjust for maintenance and breakdowns 30% Tax is paid in the year of income 10% Applies to non-automated and automated options 2,500,000 Mine uses MD4400AC trains 15 Operative life is shorter than average due to continued operation of trains and load requirements 500,000 Fuel, spare parts and related materials 200,000 Straight Line Rate = 1/Locomotive Life 0.00 Mine location and associated costs effectively make locomotives no salvageable 4 Two drivers operate each train. 12 Each shift covers the trip from the mine to the port or from the port to the mine. 42 Averaged as drivers will work 2 weeks on 2 weeks off. 48 Net of leave 2 51,840 27 220,000 Notes Information on Automation Additional capital outlay to rail line ($) Salvage of additional capital outlay to rail line ($) Additional capital outlay to locomotive ($, per locomotive) Salvage of additional capital outlay to locomotives ($, per locomotive) Additional working capital ($) Fuel efficiency usage adjustment Maintenance cost adjustment Drivers required Total automation technicians required Automation technician's average annual salary ($) 35,000,000 Sensors and related materials, depreciated straight line over life of mine 0 250,000 Sensors and related materials required for all new locomotives, depreciated straight line over life of locomotive 0 1,000,000 Total across rail line and all trains 93% Automation reduces fuel usage as locomotives operate more efficiently, e.g. reduces cost by 7% 95% Automation reduces maintenance costs through less wear and tear, and breakdowns of locomotives, e.g. reduces cost by 5% 0 No drivers required due to automation 6 Additional technicians required to maintain locomotives and rail line 150,000
Step by Step Solution
There are 3 Steps involved in it

Get step-by-step solutions from verified subject matter experts