

Question: BMI = Bo + B1 X. A B C D E F G H BMI Diet soda 30.28 37.1 42.33 57.7 36.61 38.3 Regression ?


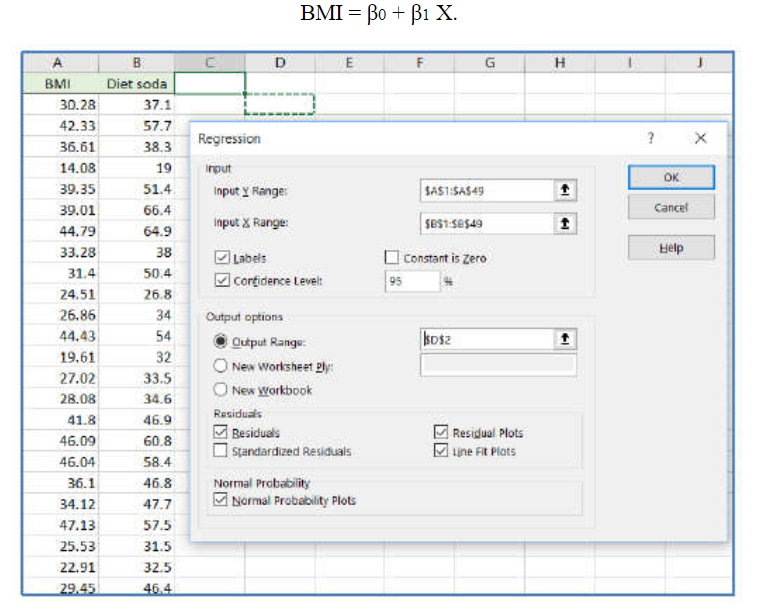
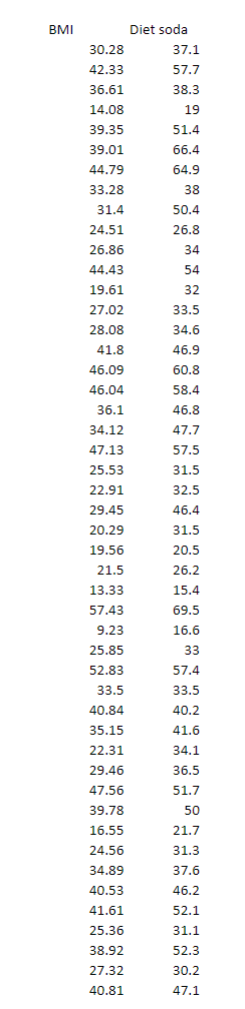
BMI = Bo + B1 X. A B C D E F G H BMI Diet soda 30.28 37.1 42.33 57.7 36.61 38.3 Regression ? X 14.08 19 Input OK 39.35 51.4 Input Y Ranger SAST:5AS49 39.01 66.4 Cancel 44.79 64.9 Input X Range: TEST:58549 33.28 38 Labels Constant is Zero Help 31.4 50.4 Confidence Level: 95 24.51 26.8 26.86 34 Output options 44.43 54 Output Range: 19.61 32 O New Worksheet Bly: 27.02 33.5 28.08 34.6 New Workbook 41.8 46.9 Residuals 46.09 60.8 Residuals Residual Plots Standardized Residuals 46.04 Line Fit Plots 58.4 36.1 46.8 Normal Probability 34.12 47.7 Normal Probability Plots 47.13 57.5 25.53 31.5 22.91 32.5 29.45 46.4BMI Diet soda 30.28 37.1 42.33 57.7 36.61 38.3 14.08 19 39.35 51.4 39.01 66.4 44.79 64.9 33.28 38 31.4 50.4 24.51 26.8 26.86 34 44.43 54 19.61 32 27.02 33.5 28.08 34.6 41.8 46.9 46.09 60.8 46.04 58.4 36.1 46.8 34.12 47.7 47.13 57.5 25.53 31.5 22.91 32.5 29.45 46.4 20.29 31.5 19.56 20.5 21.5 26.2 13.33 15.4 57.43 69.5 9.23 16.6 25.85 33 52.83 57.4 33.5 33.5 40.84 40.2 35.15 41.6 22.31 34.1 29.46 36.5 47.56 51.7 39.78 50 16.55 21.7 24.56 31.3 34.89 37.6 40.53 46.2 41.61 52.1 25.36 31.1 38.92 52.3 27.32 30.2 40.81 47.1
Step by Step Solution
There are 3 Steps involved in it
To perform a regression analysis with the given data using the form textBMI beta0 beta1 X where X re... View full answer

Get step-by-step solutions from verified subject matter experts