

Question: Bookmarks Citation Machine:.. Desmos Graphing. [. Learn to code | Cod. . Democracy Now! |. Turnitin |Statics_ENGR 2214 IM. Reduced Row Echel.. A paper mill
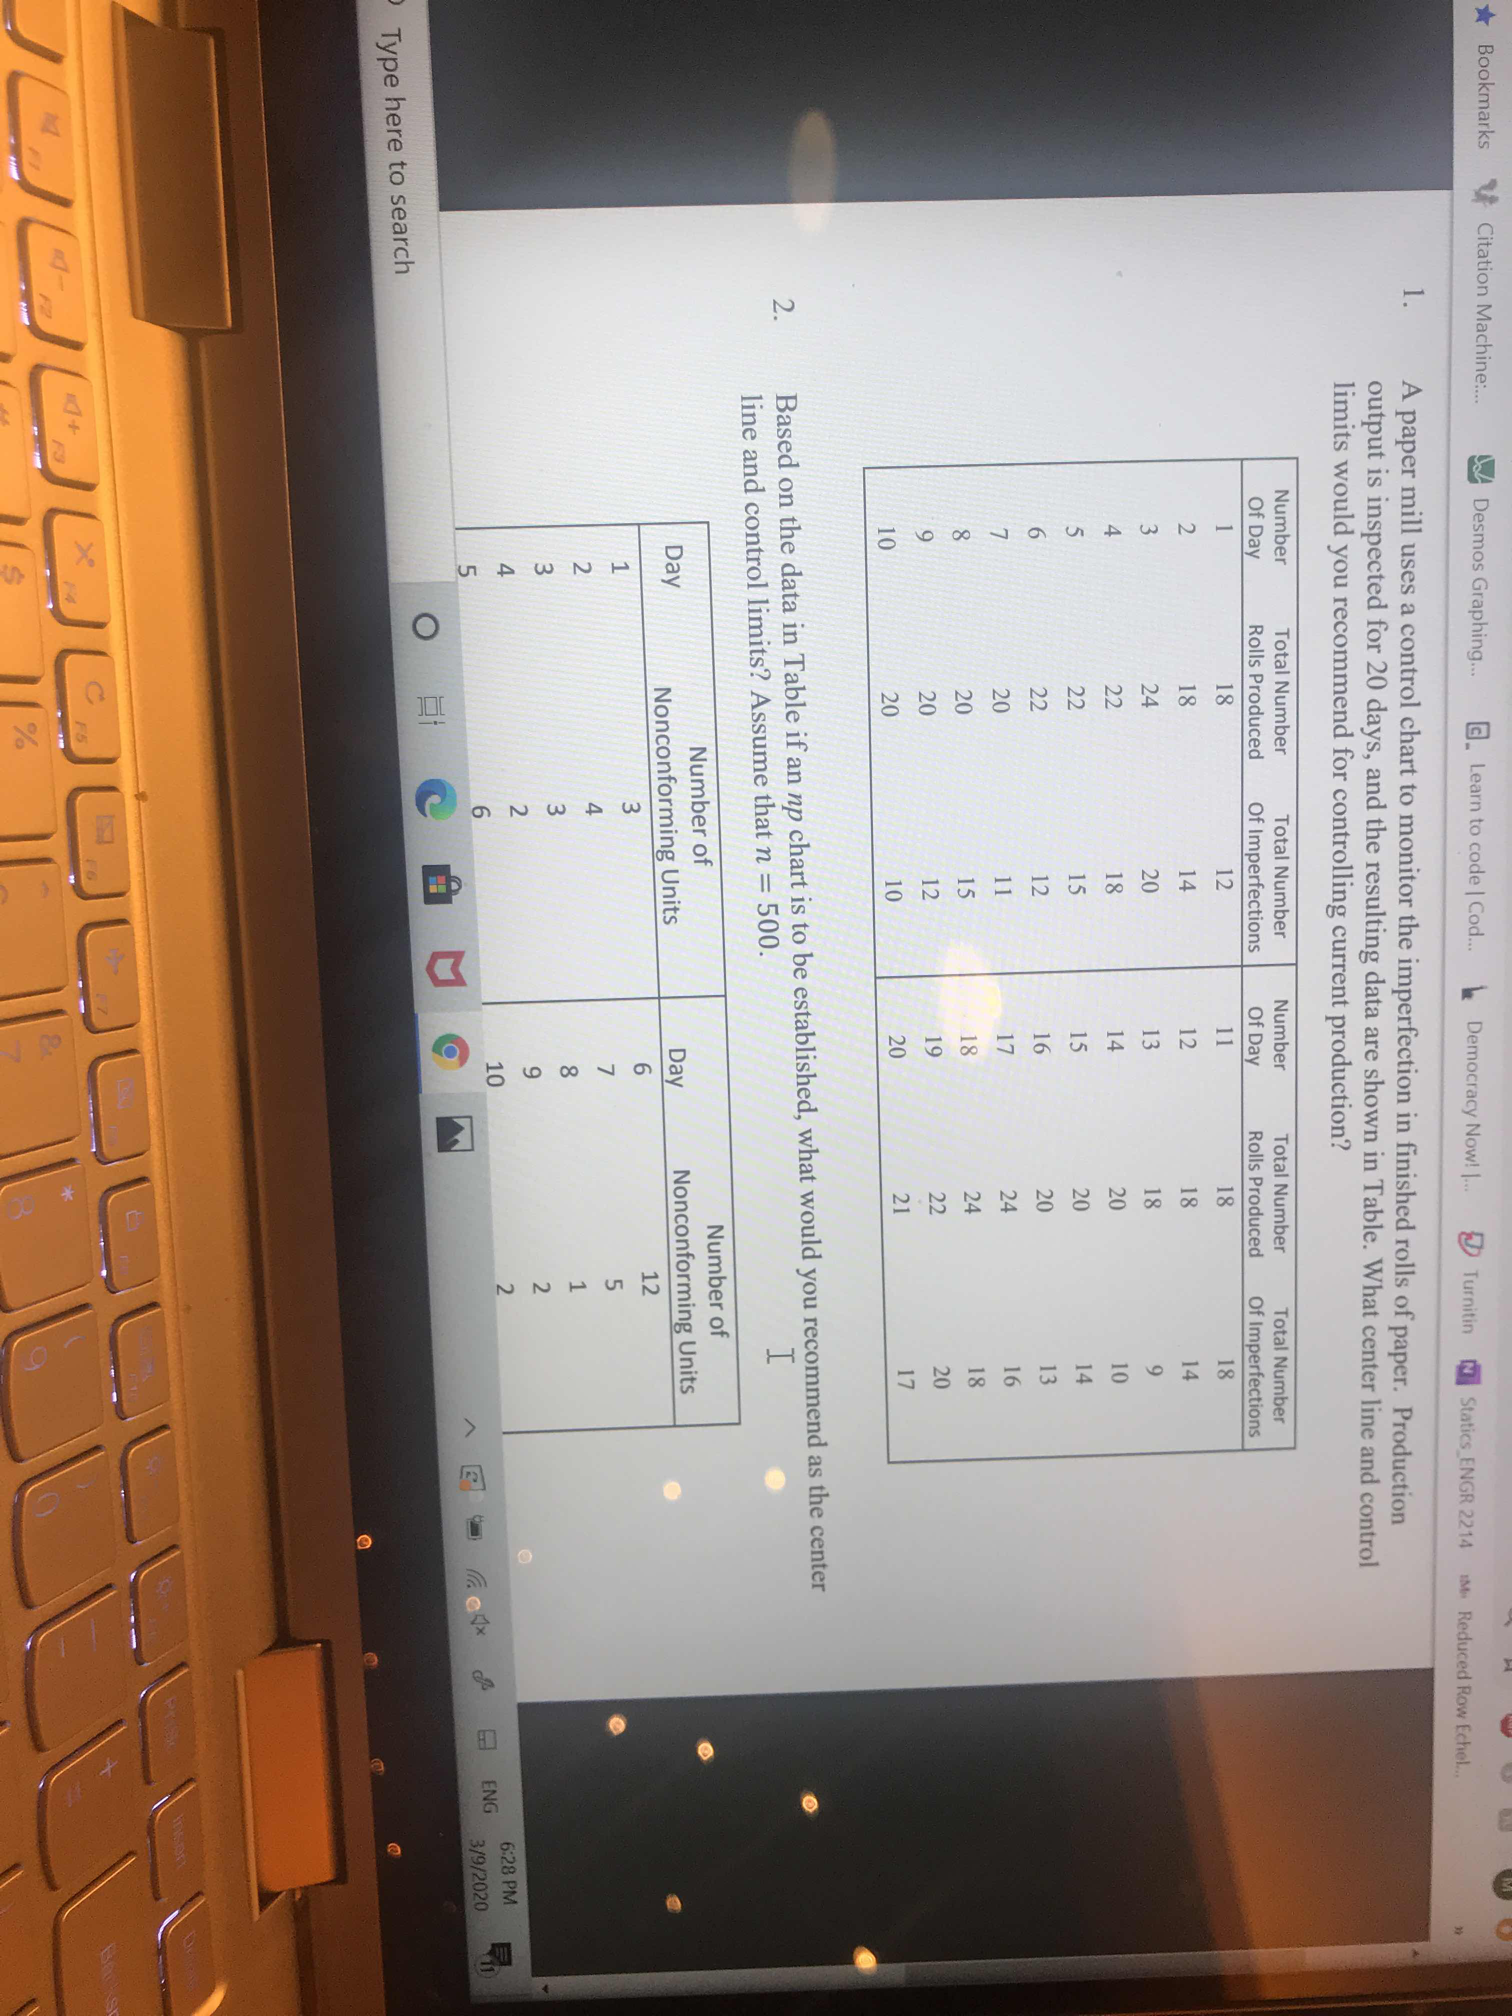
Bookmarks Citation Machine:.. Desmos Graphing. [. Learn to code | Cod. . Democracy Now! |. Turnitin |Statics_ENGR 2214 IM. Reduced Row Echel.. A paper mill uses a control chart to monitor the imperfection in finished rolls of paper. Production output is inspected for 20 days, and the resulting data are shown in Table. What center line and control limits would you recommend for controlling current production? Number Total Number Total Number Number Total Number Of Day Total Number Rolls Produced Of Imperfections Of Day Rolls Produced Of Imperfections actme Based on the data in Table if an np chart is to be established, what would you recommend as the center line and control limits? Assume that n = 500 H Number of Number of Day Nonconforming Units Day Nonconforming Units O m + m NO O ENG 6:28 PM O O 3/9/2020 Type here to search X U 14
Step by Step Solution
There are 3 Steps involved in it

Get step-by-step solutions from verified subject matter experts