

Question: Bookmarks People Window Help Module 8: Portfolio Project X C Option #2: Personal Finance courses/12814/assignments/251488 Option #2: Personal Finance Application Part A: Ratio Analysis (Week
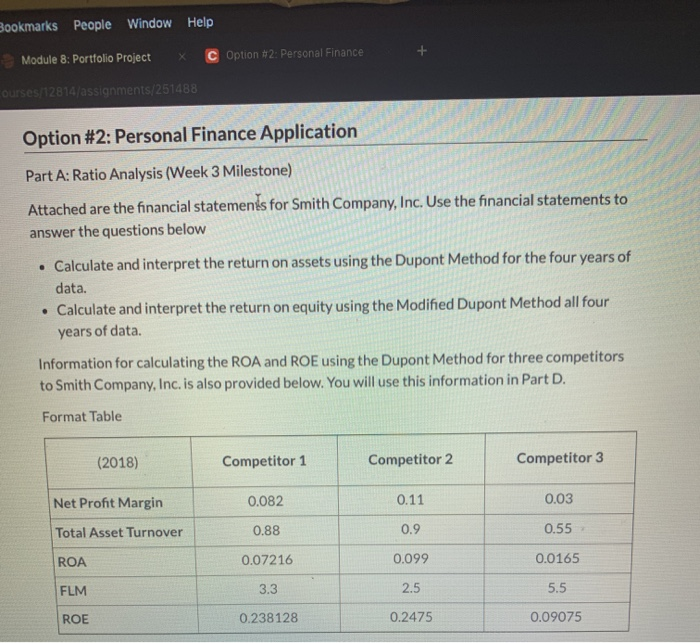
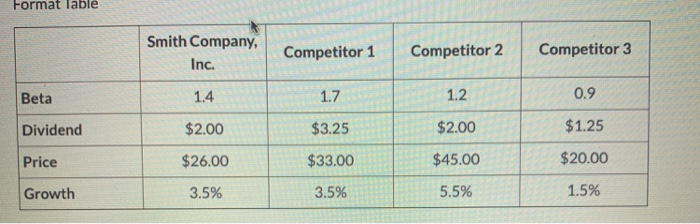
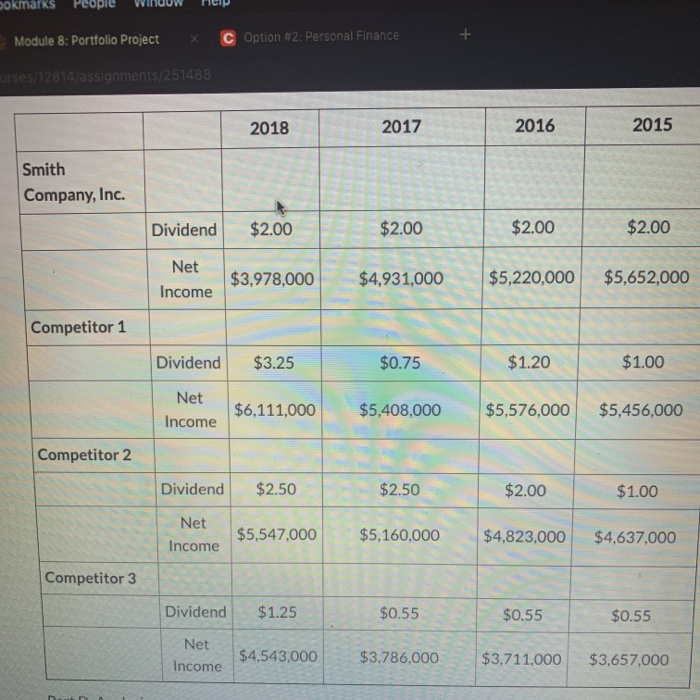
Bookmarks People Window Help Module 8: Portfolio Project X C Option #2: Personal Finance courses/12814/assignments/251488 Option #2: Personal Finance Application Part A: Ratio Analysis (Week 3 Milestone) Attached are the financial statements for Smith Company, Inc. Use the financial statements to answer the questions below Calculate and interpret the return on assets using the Dupont Method for the four years of data. Calculate and interpret the return on equity using the Modified Dupont Method all four years of data. Information for calculating the ROA and ROE using the Dupont Method for three competitors to Smith Company, Inc. is also provided below. You will use this information in Part D. Format Table (2018) Competitor 1 Competitor 2 Competitor 3 Net Profit Margin 0.11 0.03 0.082 0.88 Total Asset Turnover 0.9 0.55 ROA 0.099 0.0165 0.07216 3.3 FLM 2.5 5.5 ROE 0.238128 0.2475 0.09075 bokmarks People WINOUW HUIP Module 8: Portfolio Project X Option #2: Personal Finance urses/12814/assignments/251488 2018 2017 2016 2015 Smith Company, Inc. NI TO Dividend $2.00 $2.00 $2.00 $2.00 Net Income $3,978,000 $4,931,000 $5,220,000 $5,652,000 Competitor 1 Dividend $3.25 $0.75 $1.20 $1.00 Net Income $6,111,000 $5,408,000 $5,576,000 $5,456,000 Competitor 2 Dividend $2.50 $5,547,000 $2.50 $5,160,000 $2.00 $4,823,000 $1.00 $4,637,000 | Net Income Competitor 3 Dividend $1.25 $0.55 $0.55 $0.55 Net $4,543,000 $3,786,000 Income $3,711,000 $3,657,000 Bookmarks People Window Help Module 8: Portfolio Project X C Option #2: Personal Finance courses/12814/assignments/251488 Option #2: Personal Finance Application Part A: Ratio Analysis (Week 3 Milestone) Attached are the financial statements for Smith Company, Inc. Use the financial statements to answer the questions below Calculate and interpret the return on assets using the Dupont Method for the four years of data. Calculate and interpret the return on equity using the Modified Dupont Method all four years of data. Information for calculating the ROA and ROE using the Dupont Method for three competitors to Smith Company, Inc. is also provided below. You will use this information in Part D. Format Table (2018) Competitor 1 Competitor 2 Competitor 3 Net Profit Margin 0.11 0.03 0.082 0.88 Total Asset Turnover 0.9 0.55 ROA 0.099 0.0165 0.07216 3.3 FLM 2.5 5.5 ROE 0.238128 0.2475 0.09075 bokmarks People WINOUW HUIP Module 8: Portfolio Project X Option #2: Personal Finance urses/12814/assignments/251488 2018 2017 2016 2015 Smith Company, Inc. NI TO Dividend $2.00 $2.00 $2.00 $2.00 Net Income $3,978,000 $4,931,000 $5,220,000 $5,652,000 Competitor 1 Dividend $3.25 $0.75 $1.20 $1.00 Net Income $6,111,000 $5,408,000 $5,576,000 $5,456,000 Competitor 2 Dividend $2.50 $5,547,000 $2.50 $5,160,000 $2.00 $4,823,000 $1.00 $4,637,000 | Net Income Competitor 3 Dividend $1.25 $0.55 $0.55 $0.55 Net $4,543,000 $3,786,000 Income $3,711,000 $3,657,000
Step by Step Solution
There are 3 Steps involved in it

Get step-by-step solutions from verified subject matter experts