Question: Bookmarks Profiles Tab Window Help O ot Com Bub X S [Snapshot]: Don't Put All Your | x G Mutual Fund - Google Search X
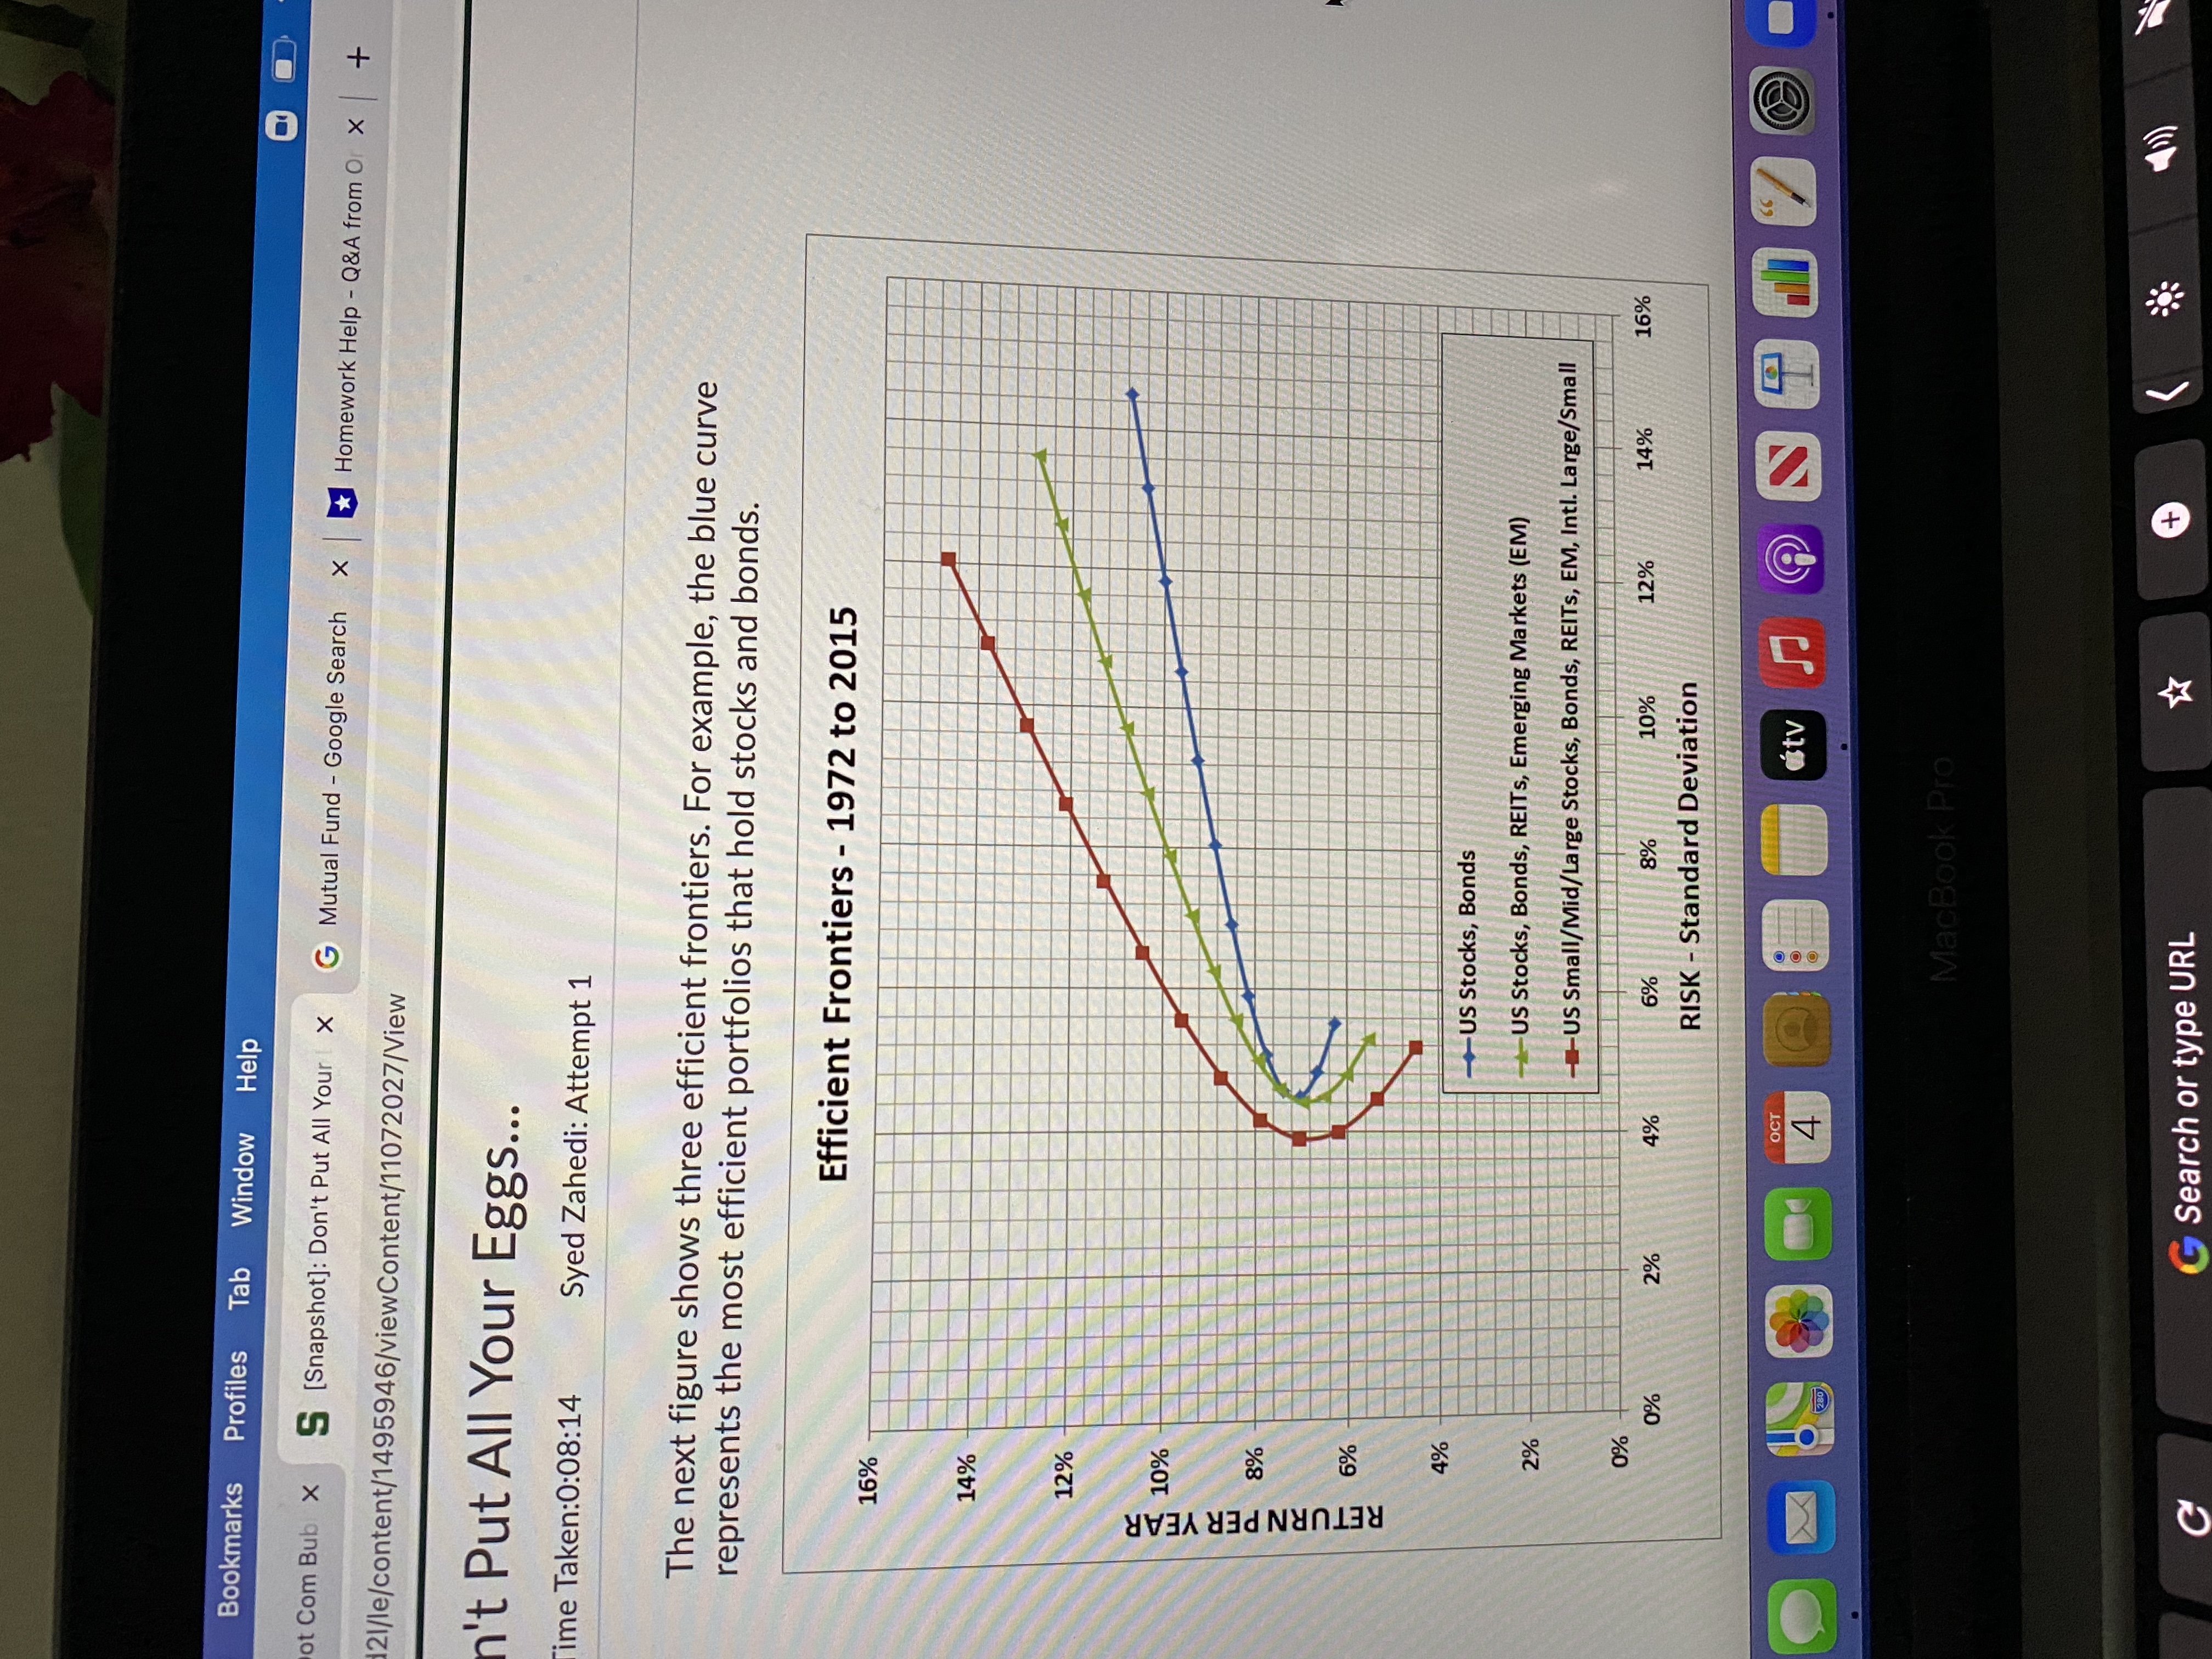
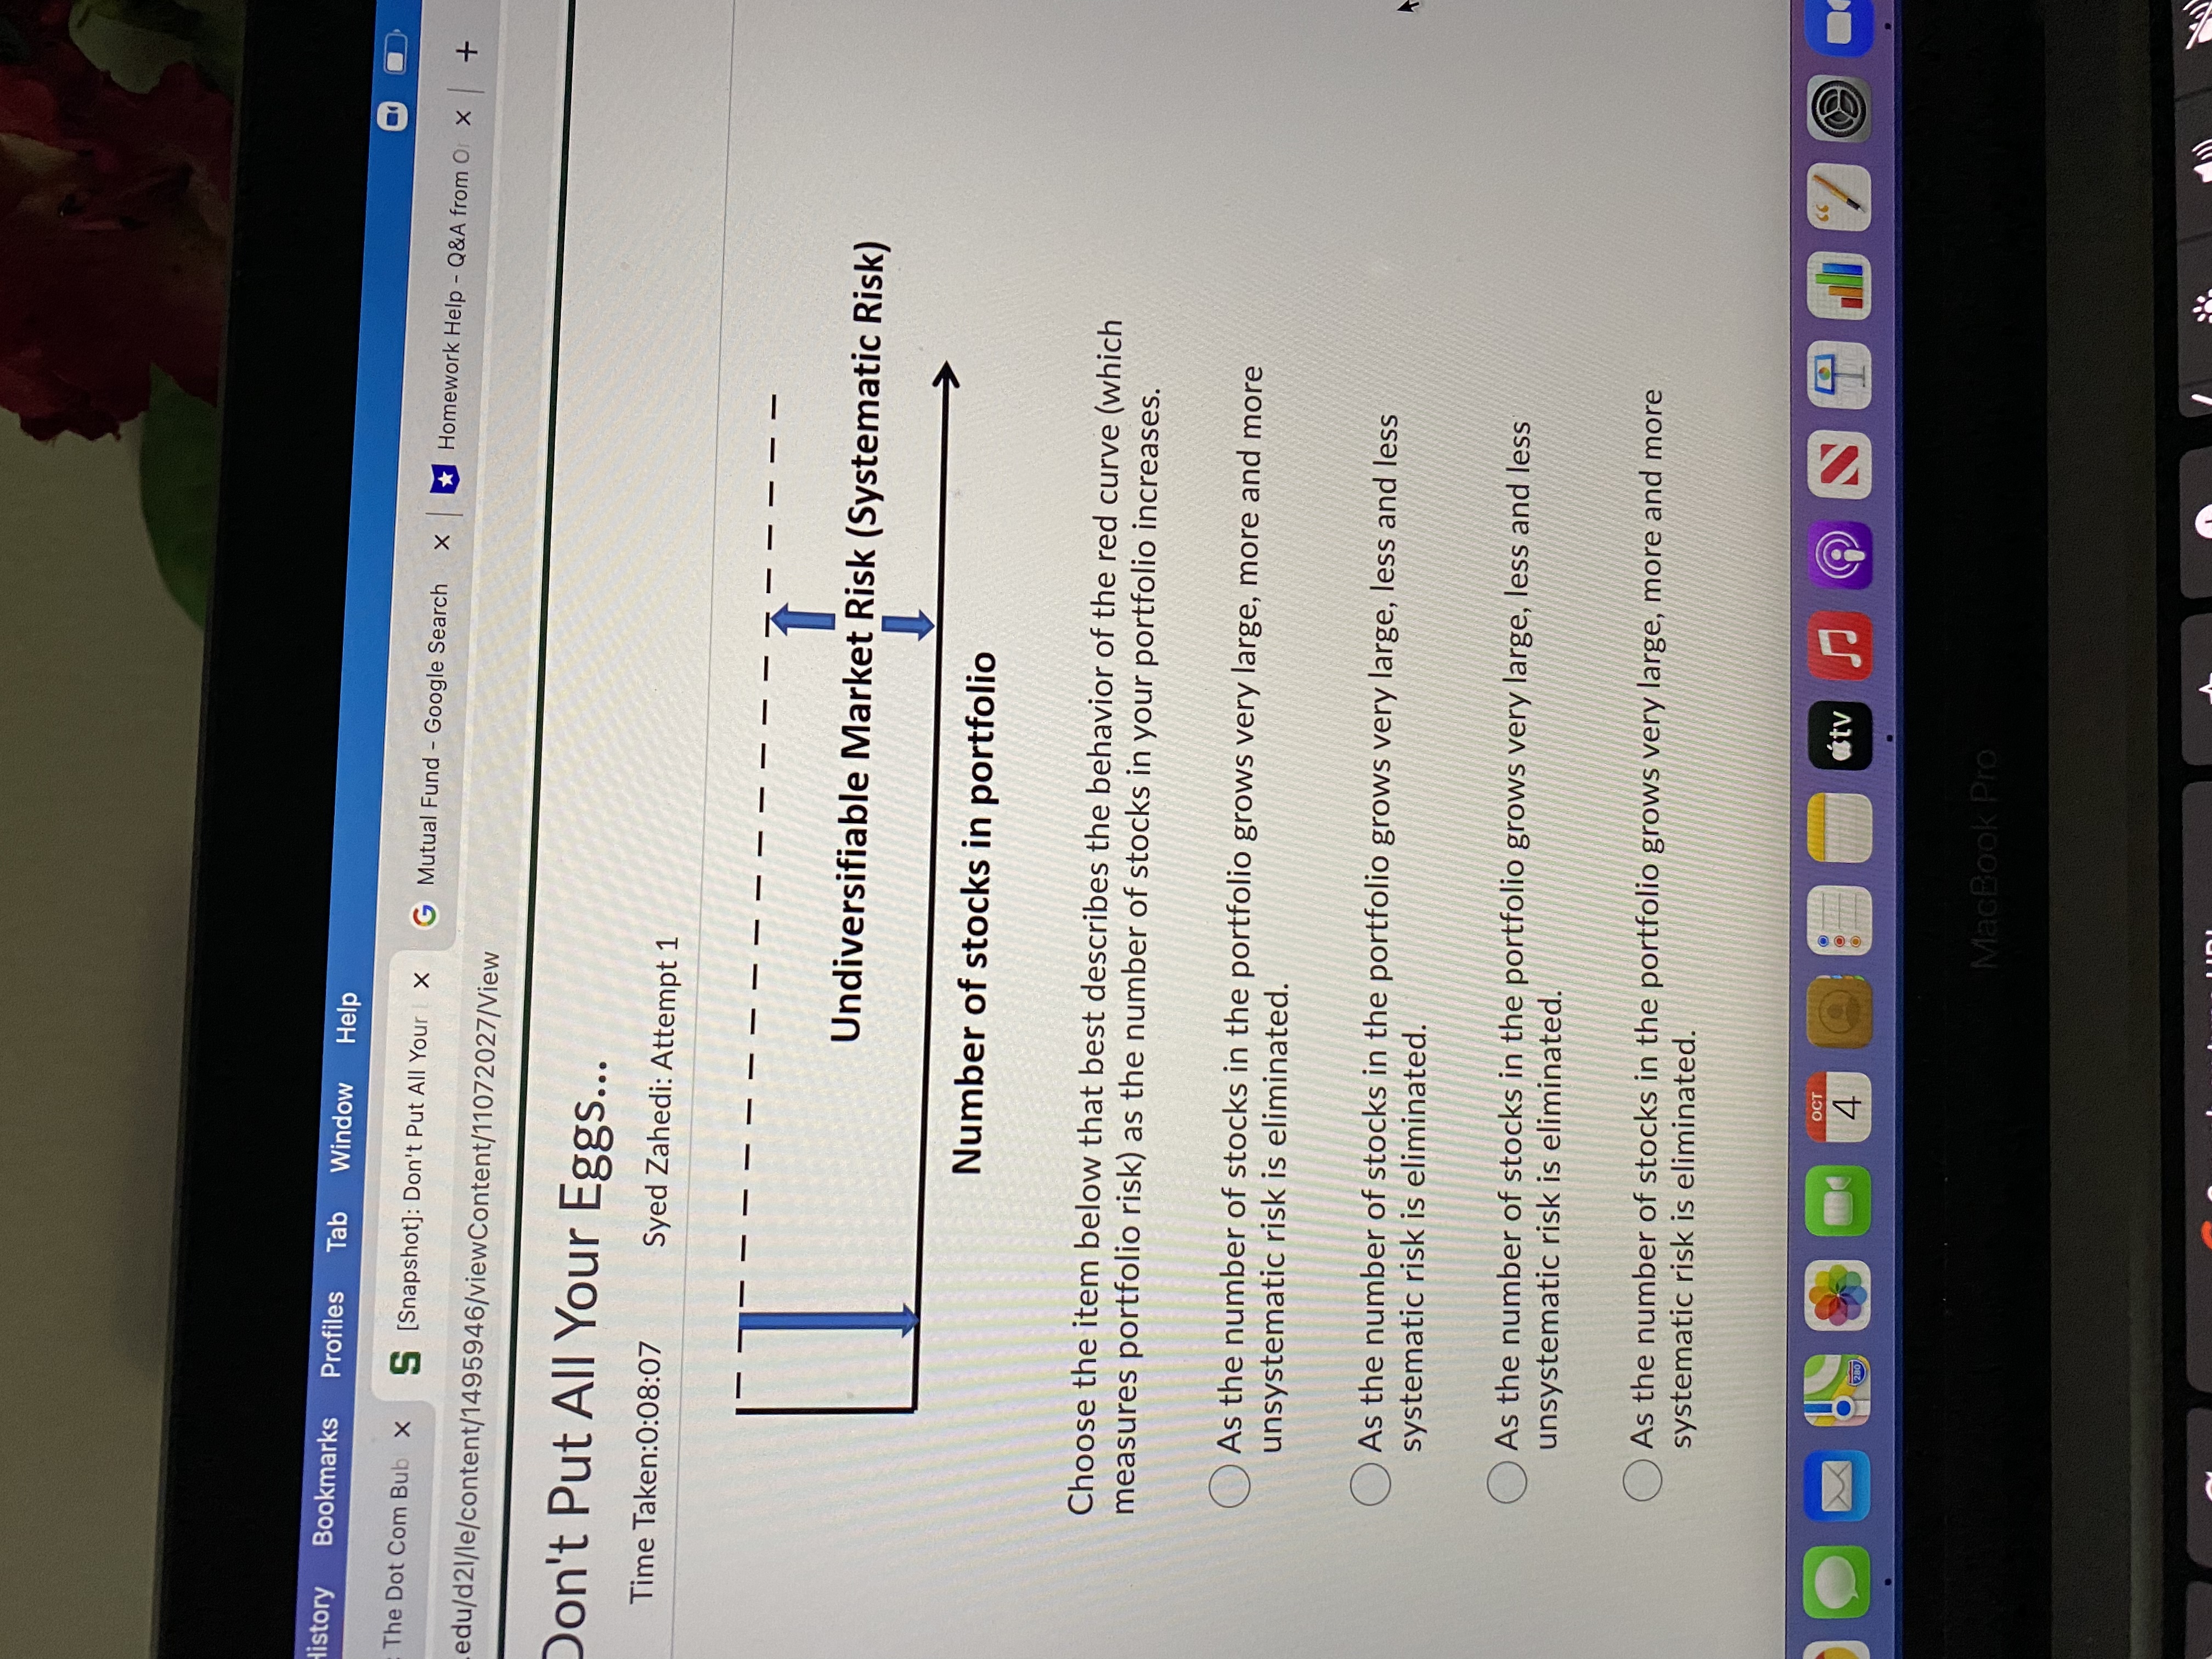
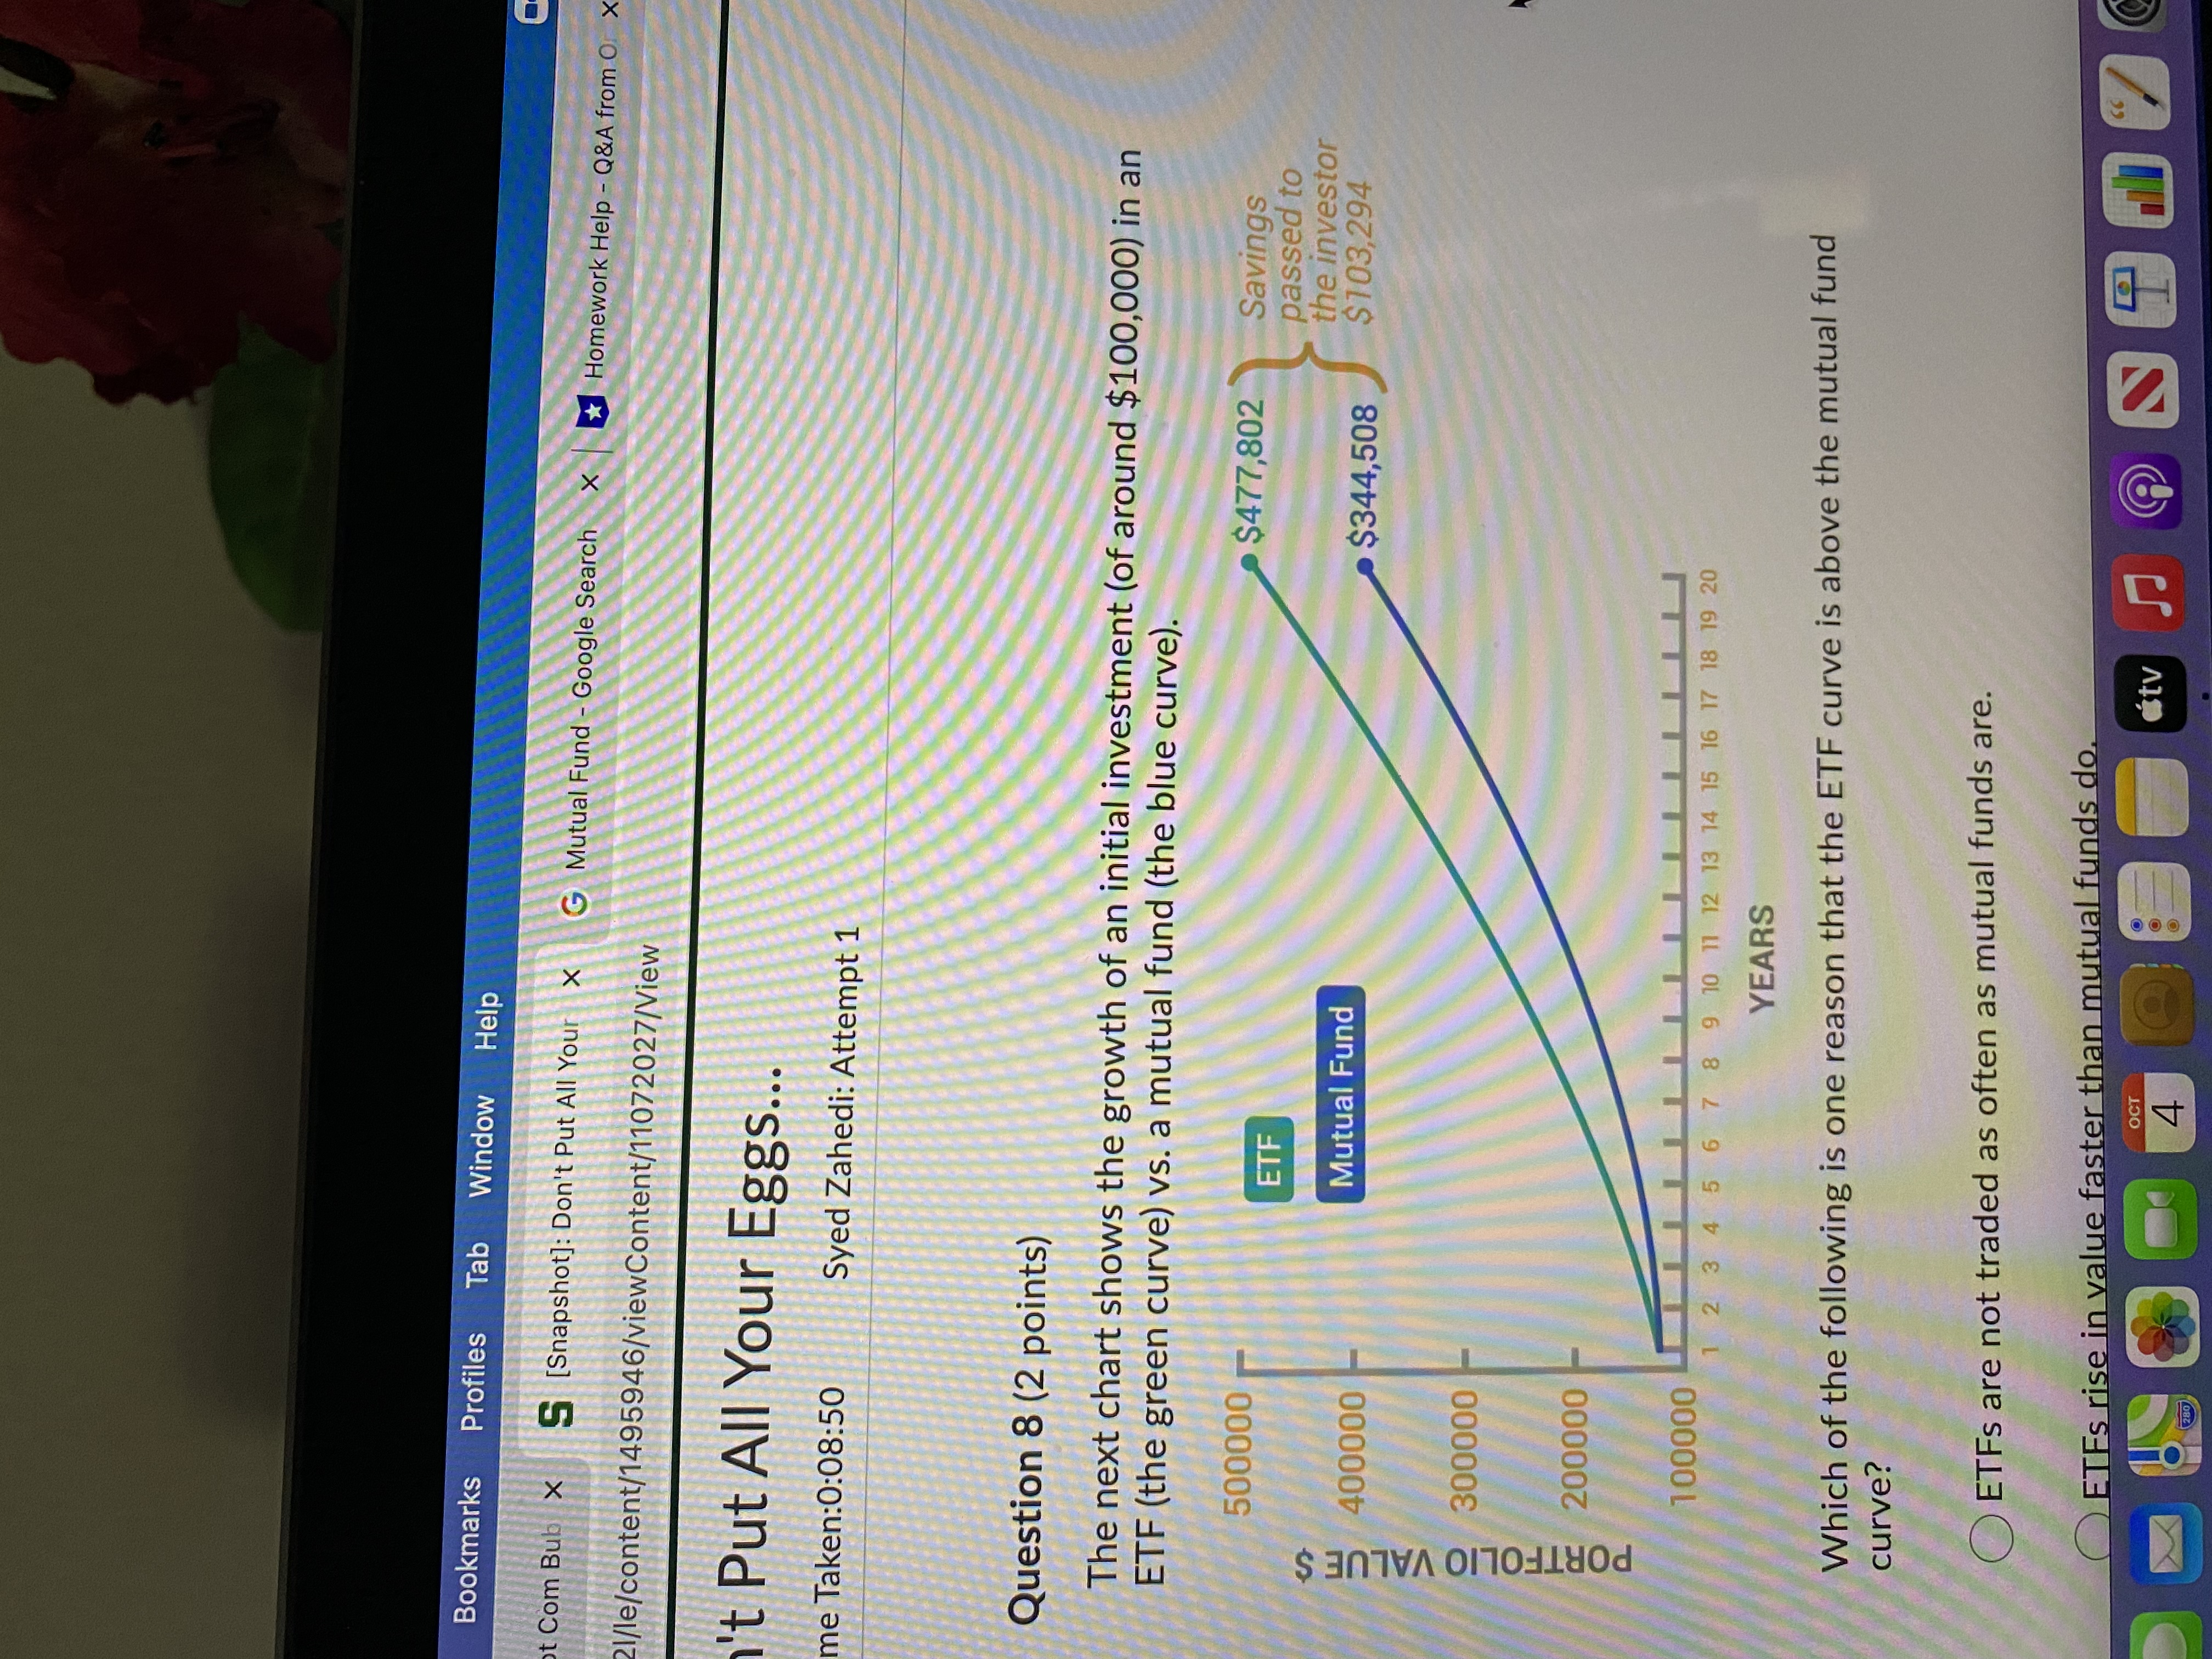
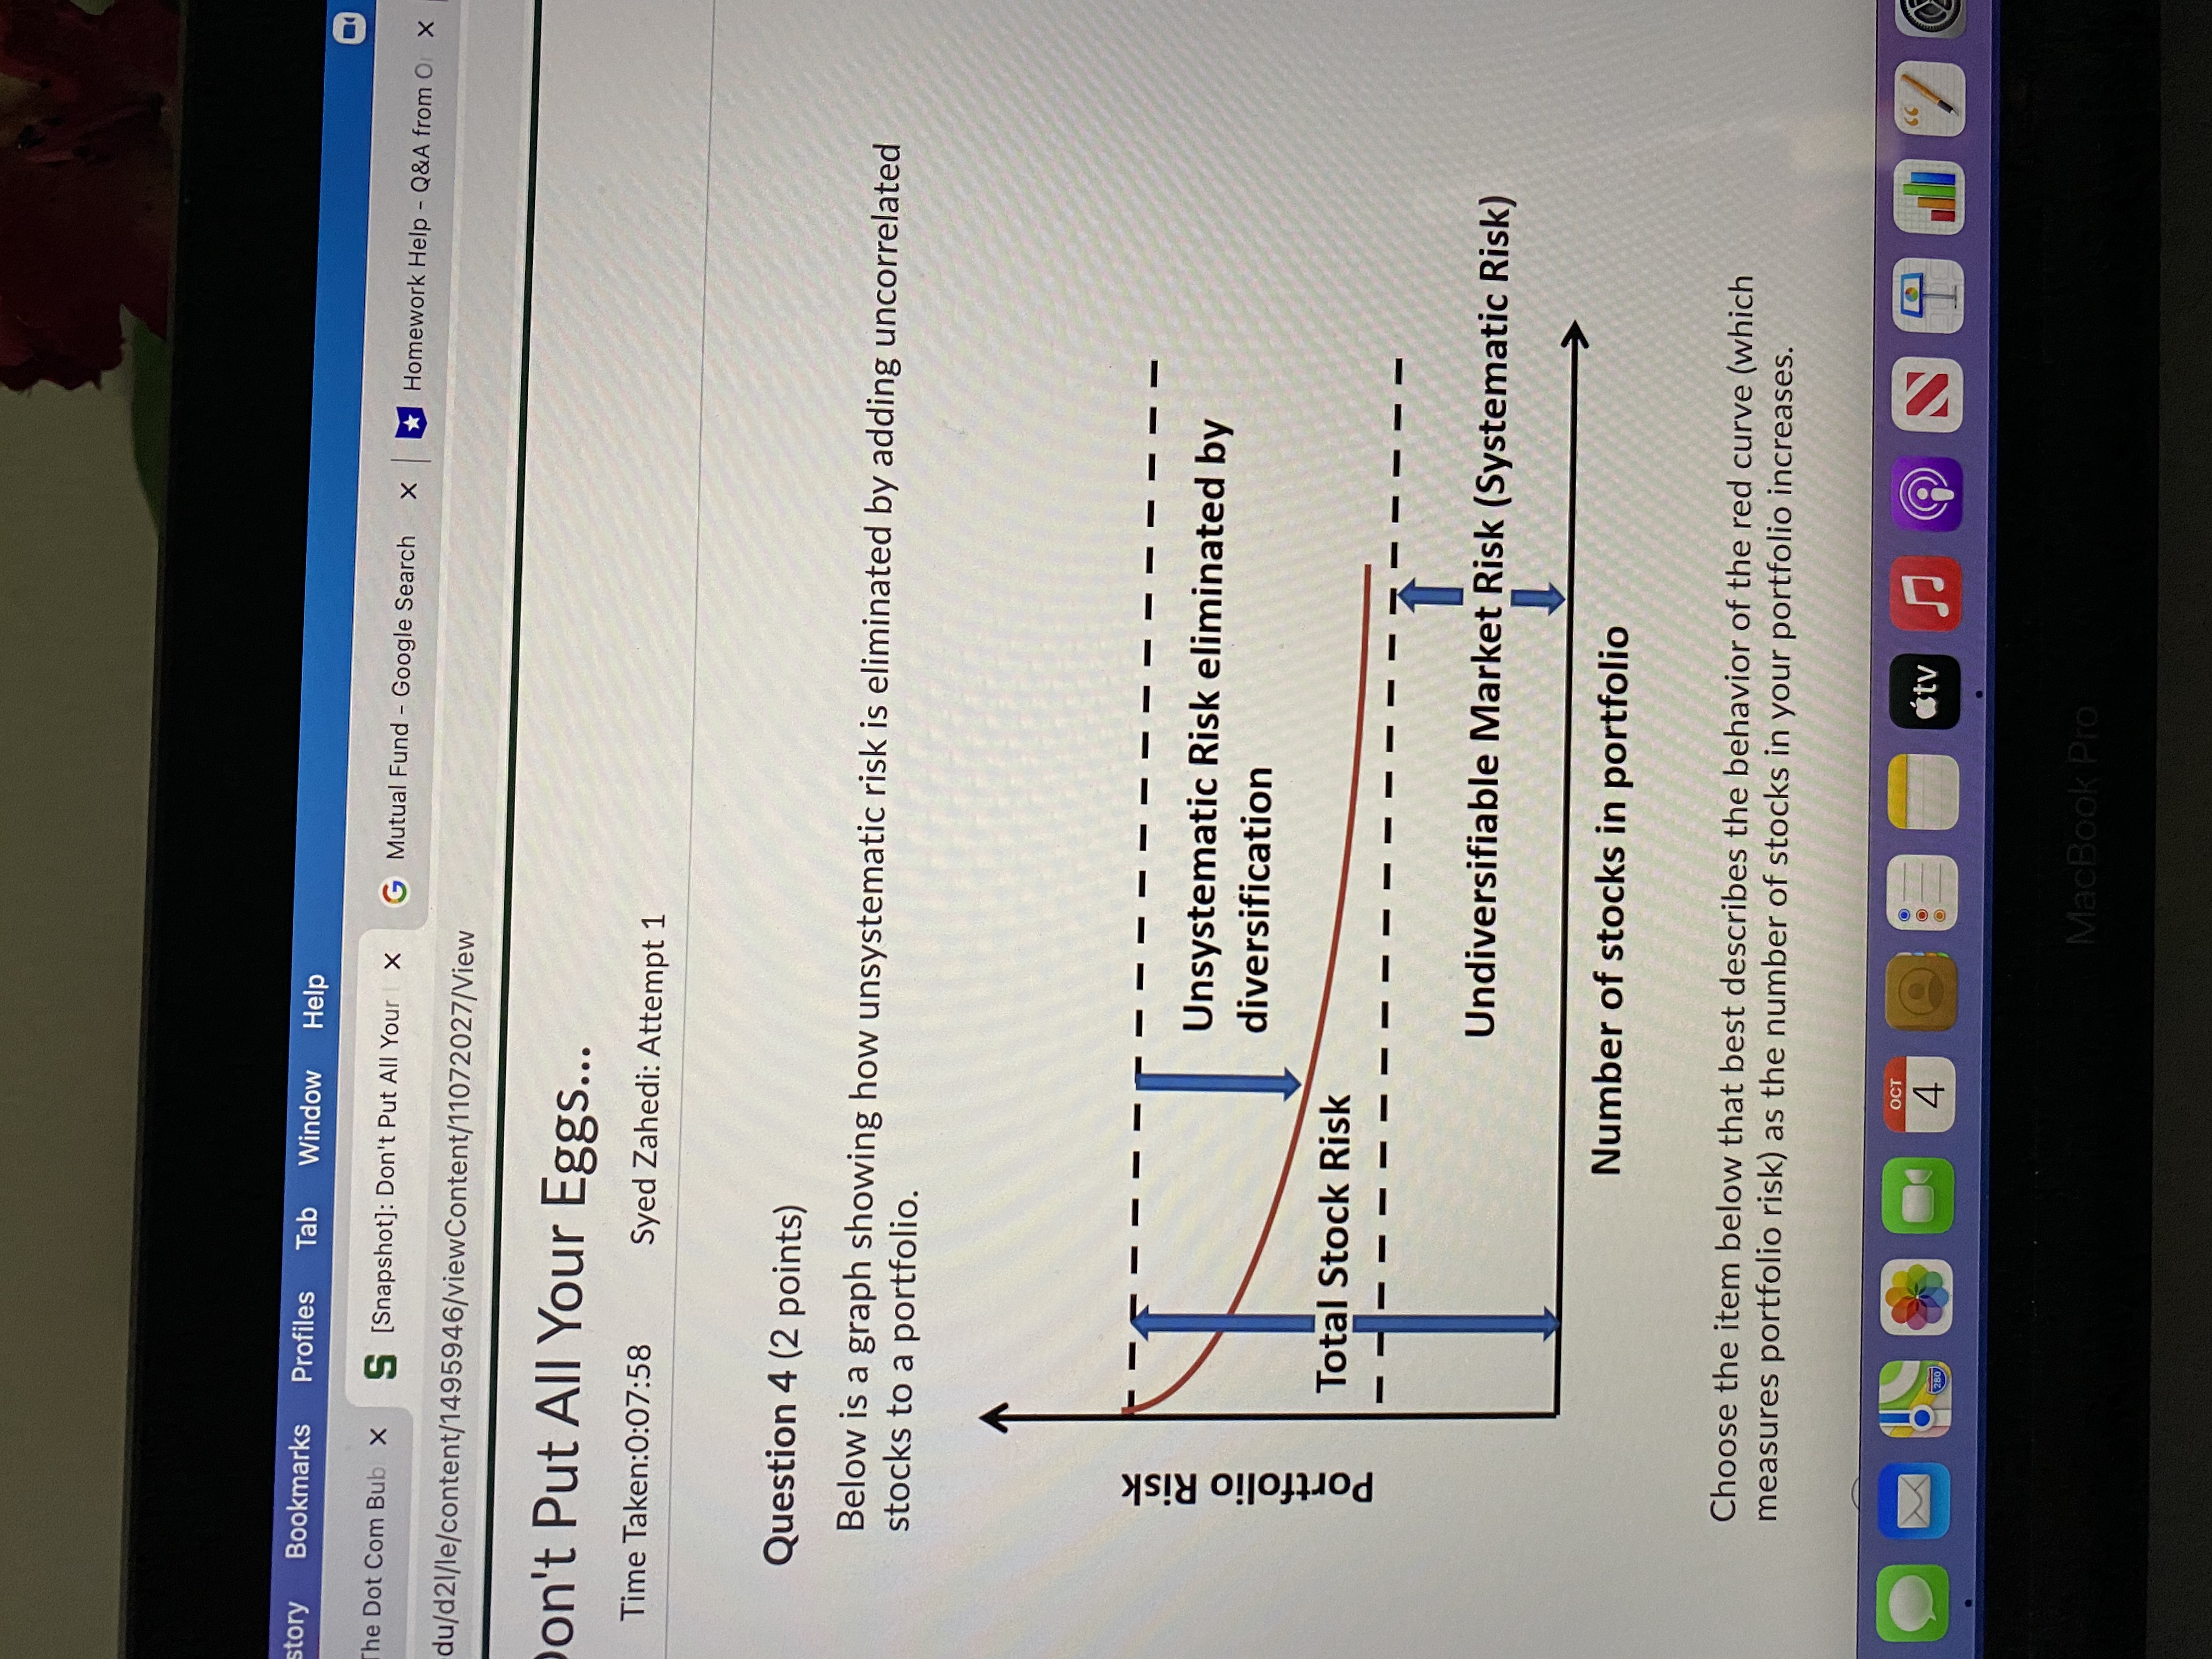
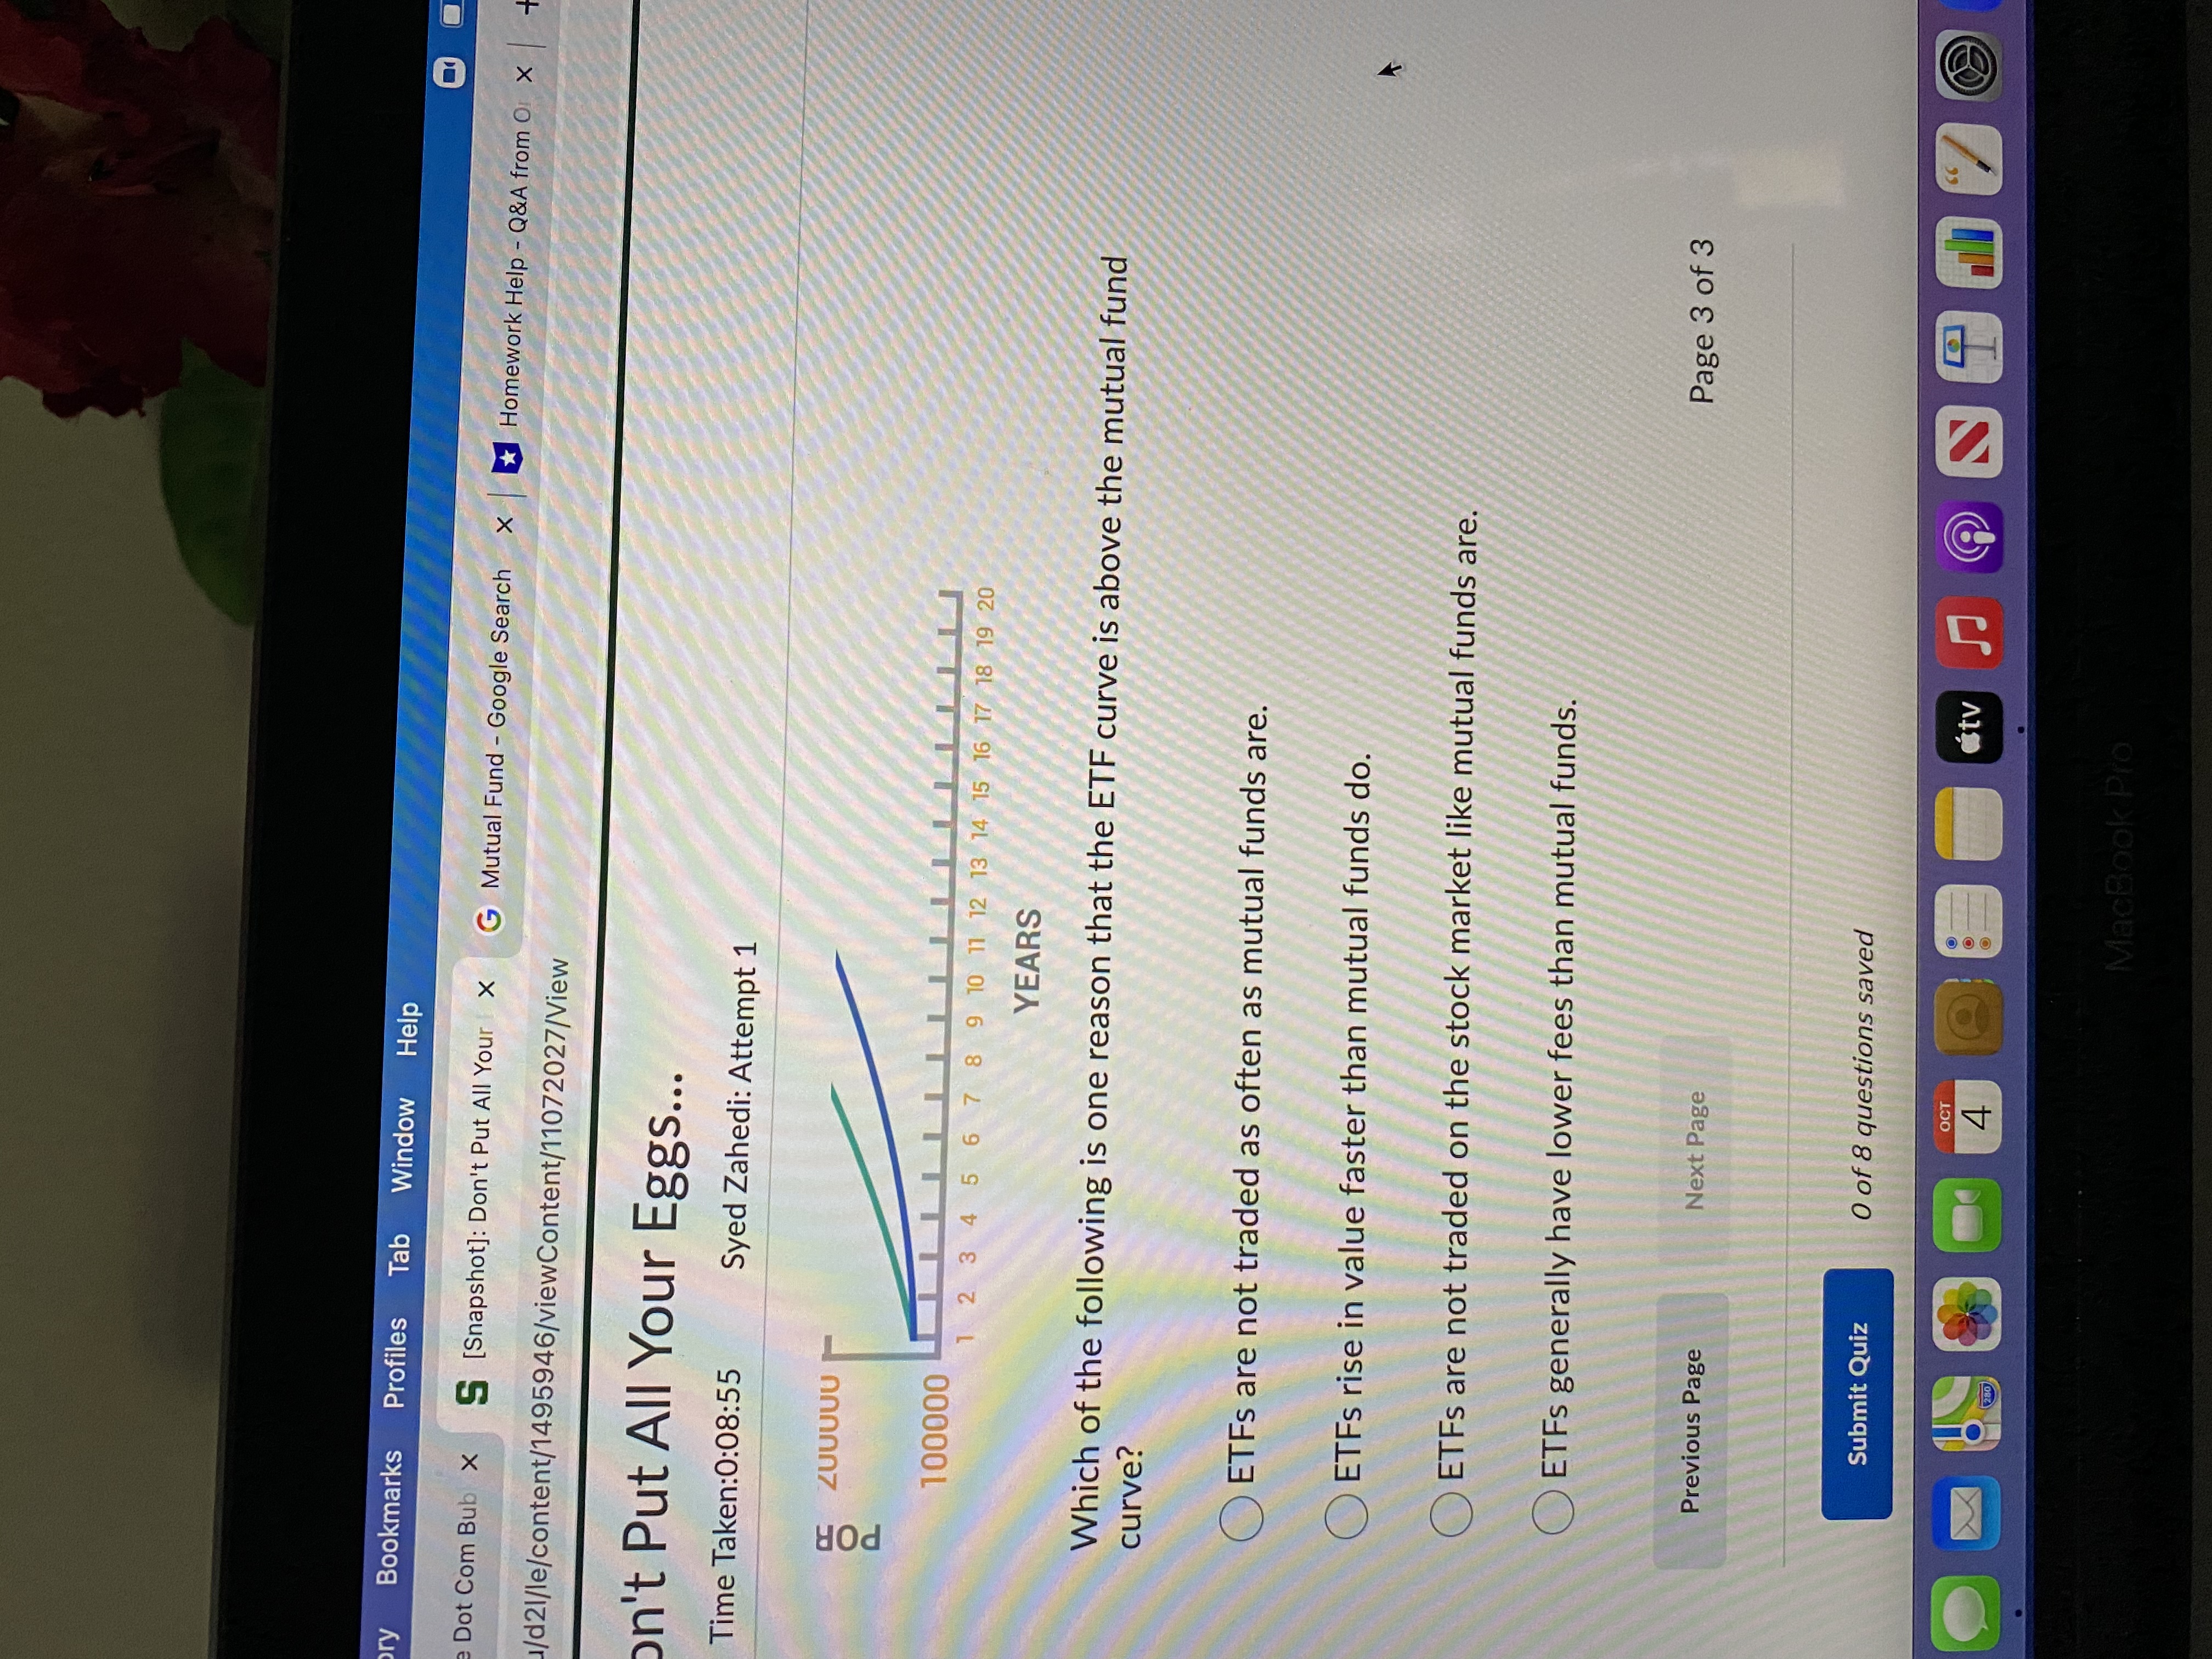
Bookmarks Profiles Tab Window Help O ot Com Bub X S [Snapshot]: Don't Put All Your | x G Mutual Fund - Google Search X Homework Help - Q&A from Or x + 21/le/content/1495946/viewContent/11072027/View n't Put All Your Eggs... ime Taken:0:08:14 Syed Zahedi: Attempt 1 The next figure shows three efficient frontiers. For example, the blue curve represents the most efficient portfolios that hold stocks and bonds. Efficient Frontiers - 1972 to 2015 16% 14% 12% 10% RETURN PER YEAR 8% 6% 4% US Stocks, Bonds US Stocks, Bonds, REITs, Emerging Markets (EM) 2% -US Small/Mid/Large Stocks, Bonds, REITs, EM, Intl. Large/Small 0% 12% 14% 16% 0% 2% 4% 6% 8% 10% RISK - Standard Deviation OCT 4 MacBook Pro + G Search or type URLBookmarks Profiles Tab Window Help Com Bub x S [Snapshot]: Don't Put All Your | X G Mutual Fund - Google Search X Homework Help - Q&A from Or x 1/le/content/1495946/viewContent/11072027/View 't Put All Your Eggs... me Taken:0:08:19 Syed Zahedi: Attempt 1 7/ -US Stocks, Bonds 2% US Stocks, Bonds, REITs, Emerging Markets (EM) -US Small/Mid/Large Stocks, Bonds, REITs, EM, Intl. Large/Small 0% 0% 2% 4% 6% 8% 10% 12% 14% 16% RISK - Standard Deviation Why is the red curve to the left of the green curve? Portfolios on the green curve are more diversified than those on the red curve. Portfolios on the red curve are more diversified than those on the green curve. Since the portfolios on the red curve contain international (intl.) stocks, they carry less risk. Since the portfolios on the green curve contain less asset classes than the portfolios on the red curve, they carry less risk. Previous Page Next Page Page 2 of 3 OCT 4 tv MacBook Pro + C G Search or type URLlistory Bookmarks Profiles Tab Window Help O The Dot Com Bub X S [Snapshot]: Don't Put All Your | X G Mutual Fund - Google Search x Homework Help - Q&A from Or x + edu/d21/le/content/1495946/viewContent/11072027/View Don't Put All Your Eggs... Time Taken:0:08:07 Syed Zahedi: Attempt 1 - - -- Undiversifiable Market Risk (Systematic Risk) Number of stocks in portfolio Choose the item below that best describes the behavior of the red curve (which measures portfolio risk) as the number of stocks in your portfolio increases. As the number of stocks in the portfolio grows very large, more and more unsystematic risk is eliminated. As the number of stocks in the portfolio grows very large, less and less systematic risk is eliminated. As the number of stocks in the portfolio grows very large, less and less unsystematic risk is eliminated. As the number of stocks in the portfolio grows very large, more and more systematic risk is eliminated. OCT at tv 4 MacBook ProBookmarks Profiles Tab Window Help t Com Bub X S [Snapshot]: Don't Put All Your X G Mutual Fund - Google Search X Homework Help - Q&A from Or 21/le/content/1495946/viewContent/11072027/View 't Put All Your Eggs... me Taken:0:08:50 Syed Zahedi: Attempt 1 Question 8 (2 points) The next chart shows the growth of an initial investment (of around $100,000) in an ETF (the green curve) vs. a mutual fund (the blue curve). 500000 $477,802 Savings ETF passed to the investor 400000 Mutual Fund $344,508 $103,294 PORTFOLIO VALUE $ 300000 200000 100000 LLLLLLLL 1 2 3 4 5 6 7 8 9 10 11 12 13 14 15 16 17 18 19 20 YEARS Which of the following is one reason that the ETF curve is above the mutual fund curve? ETFs are not traded as often as mutual funds are. ETEs rise in value faster than mutual funds do. OCT "tv 4story Bookmarks Profiles Tab Window Help The Dot Com Bub X S [Snapshot]: Don't Put All Your | x G Mutual Fund - Google Search X Homework Help - Q&A from Or x du/d21/le/content/1495946/viewContent/11072027/View on't Put All Your Eggs... Time Taken:0:07:58 Syed Zahedi: Attempt 1 Question 4 (2 points) Below is a graph showing how unsystematic risk is eliminated by adding uncorrelated stocks to a portfolio. - - Unsystematic Risk eliminated by Portfolio Risk diversification Total Stock Risk - - - - - - - - - Undiversifiable Market Risk (Systematic Risk) Number of stocks in portfolio Choose the item below that best describes the behavior of the red curve (which measures portfolio risk) as the number of stocks in your portfolio increases. OCT 4 MacBook Prory Bookmarks Profiles Tab Window Help Dot Com Bub X S [Snapshot]: Don't Put All Your | x G Mutual Fund - Google Search X Homework Help - Q&A from Or x 1/d21/le/content/1495946/viewContent/11072027/View n't Put All Your Eggs... Time Taken:0:08:55 Syed Zahedi: Attempt 1 ZUUUUU POR 100000 1 2 3 4 5 6 7 8 9 10 11 12 13 14 15 16 17 18 19 20 YEARS Which of the following is one reason that the ETF curve is above the mutual fund curve? ETFs are not traded as often as mutual funds are. ETFs rise in value faster than mutual funds do. ETFs are not traded on the stock market like mutual funds are. ETFs generally have lower fees than mutual funds. Previous Page Next Page Page 3 of 3 Submit Quiz 0 of 8 questions saved OCT 4 MacBook Pro
Step by Step Solution
There are 3 Steps involved in it
1 Expert Approved Answer
Step: 1 Unlock
Question Has Been Solved by an Expert!
Get step-by-step solutions from verified subject matter experts
Step: 2 Unlock
Step: 3 Unlock
Students Have Also Explored These Related Mathematics Questions!