

Question: Both 19-1A and 19-2A LO1 ND SING E19-1A. Cost-Volume Graphs Set up a cost-volume graph. Volume should range from zero to 24,000 units (in 4,000-unit
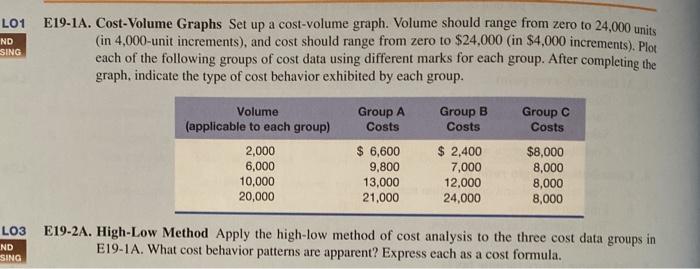
LO1 ND SING E19-1A. Cost-Volume Graphs Set up a cost-volume graph. Volume should range from zero to 24,000 units (in 4,000-unit increments), and cost should range from zero to $24,000 (in $4,000 increments). Plot each of the following groups of cost data using different marks for each group. After completing the graph, indicate the type of cost behavior exhibited by each group. Group A Costs Group B Costs Group Costs Volume (applicable to each group) 2,000 6,000 10,000 20,000 $ 6,600 9,800 13,000 21,000 $ 2,400 7,000 12,000 24,000 $8,000 8,000 8,000 8,000 LO3 E19-2A. High-Low Method Apply the high-low method of cost analysis to the three cost data groups in E19-1A. What cost behavior patterns are apparent? Express each as a cost formula. ND SING
Step by Step Solution
There are 3 Steps involved in it

Get step-by-step solutions from verified subject matter experts