

Question: Both are question 4. It's only one question. Question 4 (Mark: 10 + 5) A bakery's quarterly sales of a product (in thousands) as well
Both are question 4. It's only one question.
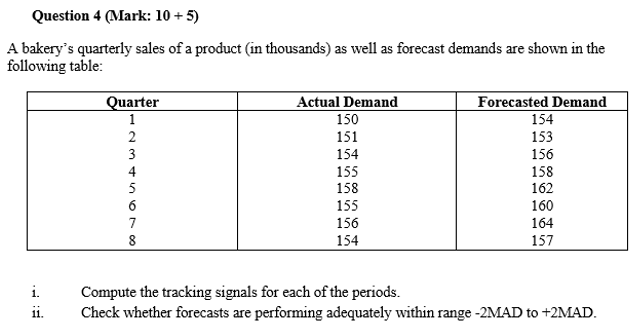
Question 4 (Mark: 10 + 5) A bakery's quarterly sales of a product (in thousands) as well as forecast demands are shown in the following table: Actual Demand 150 151 154 Quarter 1 2 3 4 5 6 7 8 155 Forecasted Demand 154 153 156 158 162 160 164 157 158 155 156 154 i. Compute the tracking signals for each of the periods. Check whether forecasts are performing adequately within range -2MAD to +2MAD. 11Step by Step Solution
There are 3 Steps involved in it
1 Expert Approved Answer
Step: 1 Unlock

Question Has Been Solved by an Expert!
Get step-by-step solutions from verified subject matter experts
Step: 2 Unlock
Step: 3 Unlock