

Question: Both net present values written in are marked as wrong. Required information (The following information applies to the questions displayed below.] Falcon Crest Aces (FCA),
![(The following information applies to the questions displayed below.] Falcon Crest Aces](https://dsd5zvtm8ll6.cloudfront.net/si.experts.images/questions/2024/09/66f783b73feae_14266f783b6d6953.jpg) Both net present values written in are marked as wrong.
Both net present values written in are marked as wrong.
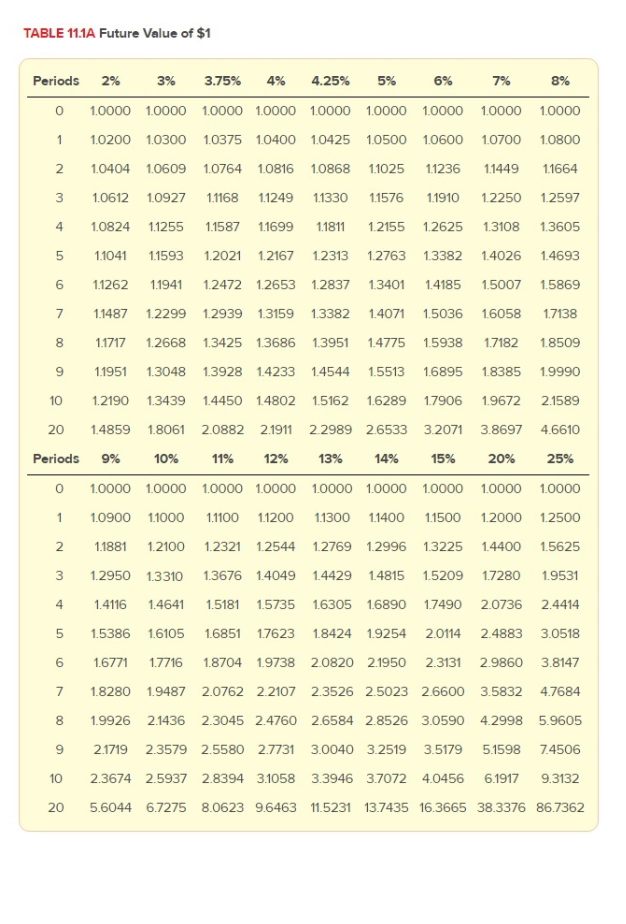
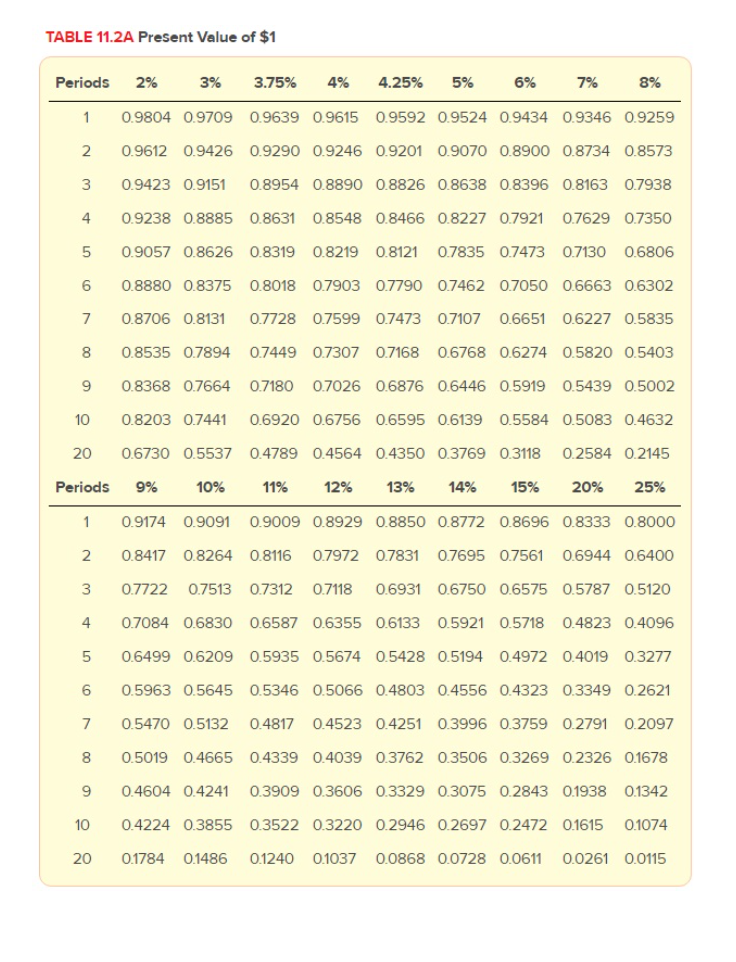
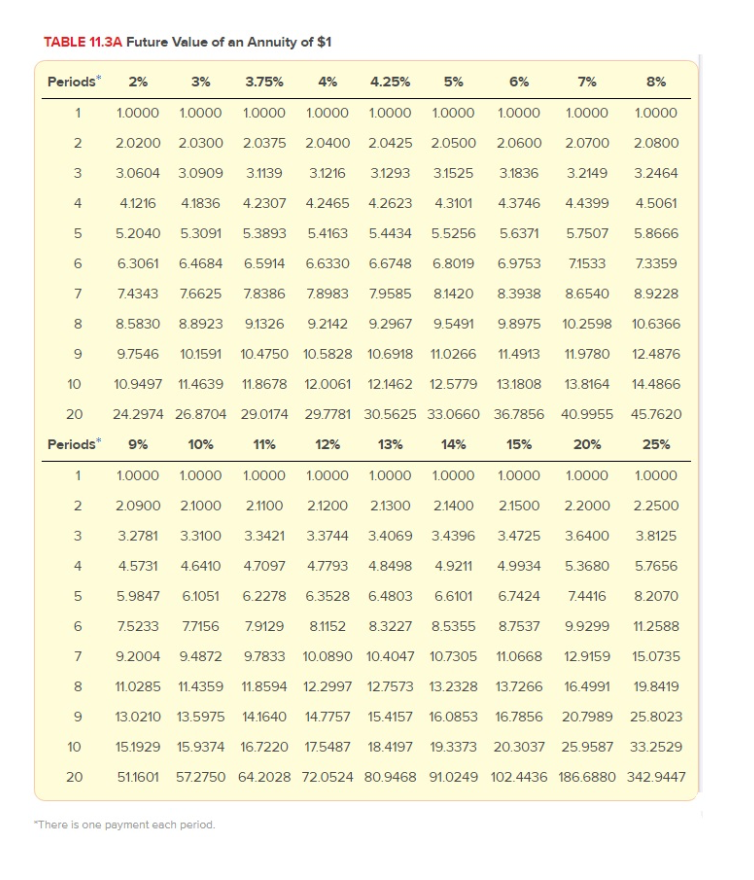
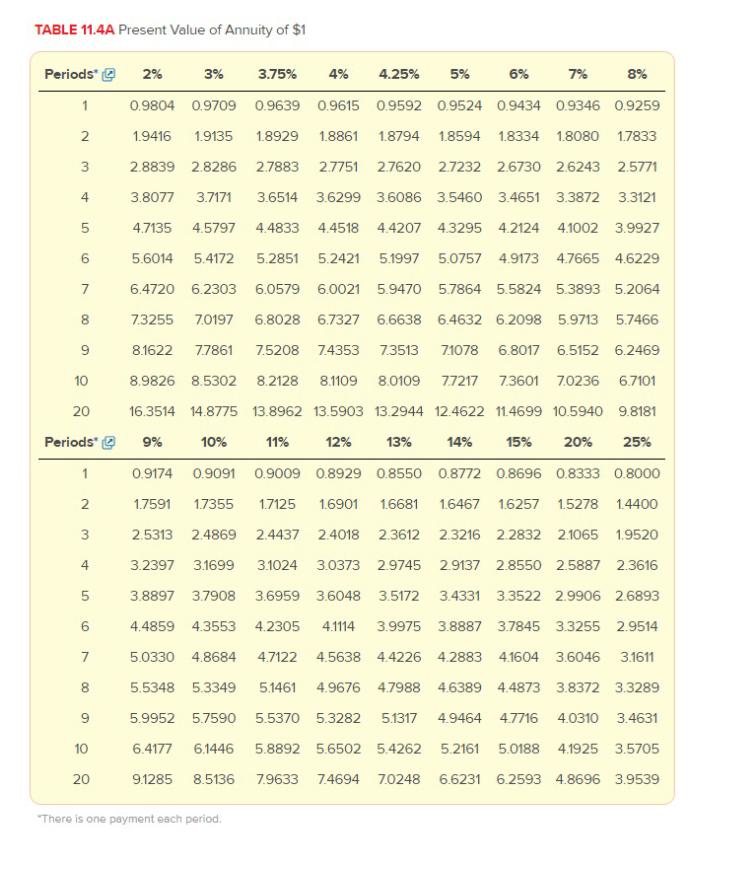
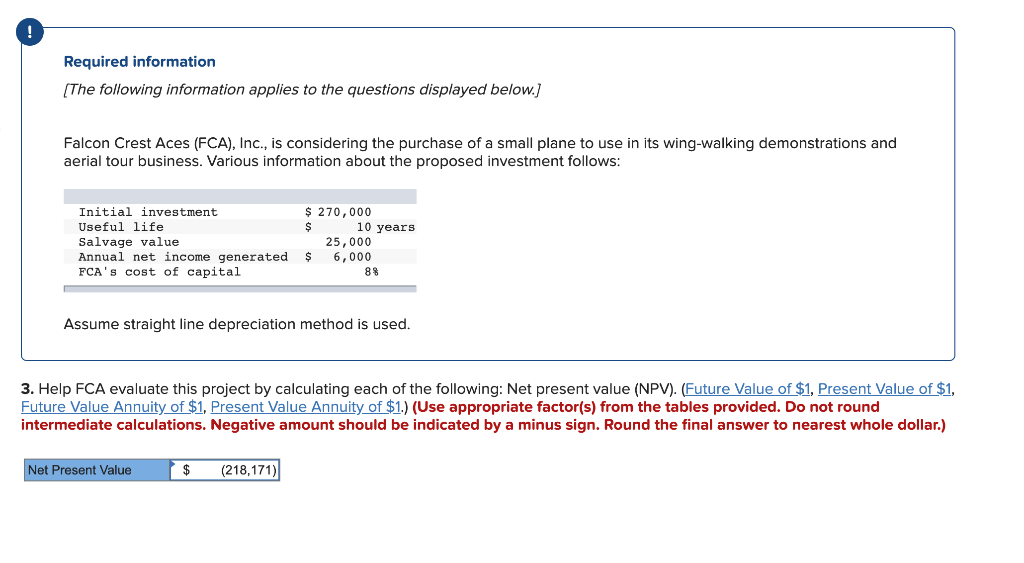
Required information (The following information applies to the questions displayed below.] Falcon Crest Aces (FCA), Inc., is considering the purchase of a small plane to use in its wing-walking demonstrations and aerial tour business. Various information about the proposed investment follows: Initial investment Useful life Salvage value Annual net income generated FCA's cost of capital $ 270,000 $ 10 years 25,000 $ 6,000 88 Assume straight line depreciation method is used. 3. Help FCA evaluate this project by calculating each of the following: Net present value (NPV). (Future Value of $1, Present Value of $1, Future Value Annuity of $1, Present Value Annuity of $1.) (Use appropriate factor(s) from the tables provided. Do not round intermediate calculations. Negative amount should be indicated by a minus sign. Round the final answer to nearest whole dollar.) Net Present Value $ (218,171) 4. Help FCA evaluate this project by calculating each of the following: Recalculate FCA's NPV assuming the cost of capital is 3 percent. (Future Value of $1, Present Value of $1, Future Value Annuity of $1, Present Value Annuity of $1.) (Use appropriate factor(s) from the tables provided. Round your final answer to the nearest whole dollar amount.) Net Present Value (200,226) TABLE 11.1A Future Value of $1 Periods 2% 3% 3.75% 4% 4.25% 5% 6% 7% 8% 0 1.0000 10000 10000 10000 10000 10000 10000 10000 10000 1 1.0800 2 1.0200 1.0300 1.0375 10400 10425 1.0500 10600 1.0700 1.0404 1.0609 1.0764 1.0816 1.0868 11025 1.1236 1.1449 1.0612 1.0927 1.1168 1.1249 1.1330 1.1576 1.1910 1.2250 1.1664 3 1.2597 4 1.0824 1.1255 1.1587 1.1699 1.1811 1.2155 1.2625 1.3108 1.3605 5 1.1041 1.1593 1.2021 1.2167 1.2313 1.2763 13382 1.4026 1.4693 6 1.1262 1.1941 1.2472 1.2653 12837 1.3401 1.4185 1.5007 1.5869 7 1.1487 1.1717 1.2299 1.2939 1.3159 1.3382 1.2668 1.3425 1.3686 1.3951 1.3048 1.3928 1.4233 1.4544 1.7138 1.8509 8 9 1.4071 1.5036 1.6058 1.4775 1.5938 1.7182 1.5513 1.6895 1.8385 1.1951 1.9990 10 1.5162 1.6289 1.7906 1.9672 2.1589 20 1.2190 1.3439 1.4450 1.4802 1.4859 1.8061 2.0882 2.1911 9% 10% 11% 12% 2.2989 2.6533 3.2071 4.6610 3.8697 20% Periods 13% 14% 15% 25% 0 1 2 1.0000 10000 10000 10000 1.0000 10000 10000 10000 10000 1.0900 1.1000 1.1100 1.1200 1.1300 11400 1.1500 1.2000 12500 1.1881 1.2100 1.2321 1.2544 1.2769 1.2996 1.3225 1.4400 1.5625 1.2950 1.3310 1.3676 1.4049 1.4429 1.4815 1.5209 17280 1.9531 1.4116 1.4641 1.5181 1.5735 1.6305 1.6890 1.7490 2.0736 2.4414 3 4 5 1.5386 1.6105 1.6851 17623 1.8424 1.9254 2.0114 2.4883 3.0518 6 1.6771 1.7716 1.8704 1.9738 2.0820 2.1950 2.3131 2.9860 3.8147 7 1.8280 1.9487 2.0762 2.2107 2.3526 2.5023 2.6600 3.5832 4.7684 1.9926 2.1436 2.3045 2.4760 2.6584 2.8526 3.0590 4.2998 5.9605 8 9 10 2.1719 2.3579 2.5580 2.7731 3.0040 3.2519 3.5179 5.1598 7.4506 2.3674 2.5937 2.8394 3.1058 3.3946 3.7072 4.0456 6.1917 9.3132 5.6044 6.7275 8.0623 9.6463 11.5231 13.7435 16.3665 38.3376 86.7362 20 TABLE 11.2A Present Value of $1 Periods 2% 3% 3.75% 4% 4.25% 5% 6% 7% 8% 1 0.9804 0.9709 0.9639 0.9615 0.9592 0.9524 0.9434 0.9346 0.9259 2 0.9612 0.9426 0.9290 0.9246 0.9201 0.9070 0.8900 0.8734 0.8573 3 0.9423 0.9151 0.8954 0.8890 0.8826 0.8638 0.8396 0.8163 0.7938 4 0.9238 0.8885 0.8631 0.8548 0.8466 0.8227 0.7921 0.7629 0.7350 5 0.9057 0.8626 0.8319 0.8219 0.8121 0.7835 0.7473 0.7130 0.6806 6 0.8880 0.8375 0.8018 0.7903 0.7790 0.7462 0.7050 0.6663 0.6302 7 0.8706 0.8131 0.7728 0.7599 0.7473 0.7107 0.6651 0.6227 0.5835 8 0.8535 0.7894 0.7449 0.7307 0.7168 0.6768 0.6274 0.5820 0.5403 9 0.8368 0.7664 0.7180 0.7026 0.6876 0.6446 0.5919 0.5439 0.5002 10 0.8203 0.7441 0.6920 0.6756 0.6595 0.6139 0.5584 0.5083 0.4632 20 0.6730 0.5537 0.4789 0.4564 0.4350 0.3769 0.3118 0.2584 0.2145 Periods 9% 10% 11% 12% 13% 14% 15% 20% 25% 1 0.9174 0.9091 0.9009 0.8929 0.8850 0.8772 0.8696 0.8333 0.8000 2 0.8417 0.8264 0.8116 0.7972 0.7831 0.7695 0.7561 0.6944 0.6400 3 0.7722 0.7513 0.7312 0.7118 0.6931 0.6750 0.6575 0.5787 0.5120 4 0.7084 0.6830 0.6587 0.6355 0.6133 0.5921 0.5718 0.4823 0.4096 5 0.6499 0.6209 0.5935 0.5674 0.5428 0.5194 0.4972 0.4019 0.3277 6 0.5963 0.5645 0.5346 0.5066 0.4803 0.4556 0.4323 0.3349 0.2621 7 0.5470 0.5132 0.4817 0.4523 0.4251 0.3996 0.3759 0.2791 0.2097 8 0.5019 0.4665 0.4339 0.4039 0.3762 0.3506 0.3269 0.2326 0.1678 9 0.4604 0.4241 0.3909 0.3606 0.3329 0.3075 0.2843 0.1938 0.1342 10 0.4224 0.3855 0.3522 0.3220 0.2946 0.2697 0.2472 0.1615 0.1074 20 0.1784 0.1486 0.1240 0.1037 0.0868 0.0728 0.0611 0.0261 0.0115 TABLE 11.3A Future Value of an Annuity of $1 Periods 2% 3% 3.75% 4% 4.25% 5% 6% 7% 8% 1 1.0000 1.0000 1.0000 1.0000 1.0000 1.0000 1.0000 1.0000 1.0000 2 2.0200 2.0300 2.0375 2.0400 2.0425 20500 2.0600 20700 2.0800 3 3.0604 3.0909 3.1139 3.1216 3.1293 3.1525 3.1836 3.2149 3.2464 4 4.1216 4.1836 4.2307 4.2465 4.2623 4.3101 4.3746 4.4399 4.5061 5 5.2040 5.3091 5.3893 5.4163 5.4434 5.5256 5.6371 5.7507 5.8666 6 6.3061 6.4684 6.5914 6.6330 6.6748 6.8019 6.9753 7.1533 73359 7 7.4343 7.6625 7.8386 7.8983 7.9585 8.1420 8.3938 8.6540 8.9228 8 8.5830 8.8923 9.1326 9.2142 9.2967 9.5491 9.8975 10.2598 10.6366 9 10 9.7546 10.1591 10.4750 10.5828 10.6918 11.0266 11.4913 11.9780 12.4876 10.9497 11.4639 11.8678 12.0061 12.1462 12.5779 13.1808 13.8164 14.4866 24.2974 26.8704 29.0174 29.7781 30.5625 33.0660 36.7856 40.9955 45.7620 20 Periods 9% 10% 11% 12% 13% 14% 15% 20% 25% 1 1.0000 1.0000 1.0000 1.0000 1.0000 1.0000 1.0000 1.0000 1.0000 2 2.0900 2.1000 2.1100 2.1200 2.1300 2.1400 2.1500 2.2000 2.2500 3 3 3.2781 3.3100 3.3421 3.3744 3.4069 3.4396 3.4725 3.6400 3.8125 4 4.5731 4.6410 4.7097 4.7793 4.8498 4.9211 4.9934 5.3680 5.7656 5 5.9847 6.1051 6.2278 6.3528 6.4803 6.6101 6.7424 7.4416 8.2070 6 7 8 7.5233 7.7156 7.9129 8.1152 8.3227 8.5355 8.7537 9.9299 11.2588 9.2004 9.4872 9.7833 10.0890 10.4047 10.7305 11.0668 12.9159 15.0735 11.0285 11.4359 11.8594 12.2997 12.7573 13.2328 13.7266 16.4991 19.8419 13.0210 13.5975 14.1640 14.7757 15.4157 16.0853 16.7856 20.7989 25.8023 15.1929 15.9374 16.7220 17.5487 18.4197 19.3373 20.3037 25.9587 33.2529 51.1601 572750 64.2028 72.0524 80.9468 91.0249 102.4436 186.6880 342.9447 9 10 20 "There is one payment each period. TABLE 11.4A Present Value of Annuity of $1 Periods 1 2 2. 3 2% 3% 3.75% 4% 4.25% 5% 7% 8% 0.9804 0.9709 0.9639 0.9615 0.9592 0.9524 0.9434 0.9346 0.9259 1.9416 1.9135 1.8929 1.8861 1.8794 1.8594 18334 1.8080 1.7833 2.8839 2.8286 2.7883 2.7751 2.7620 2.7232 2.6730 2.6243 2.5771 3.8077 3.7171 3.6514 3.6299 3.6086 3.5460 3.4651 3.3872 3.3121 4 5 6 7 00 4.7135 4.5797 4.4833 4.4518 4.4207 43295 4.2124 4.1002 3.9927 5.6014 5.4172 5.2851 5.2421 5.1997 5.0757 4.9173 4.7665 4.6229 6.4720 6.2303 6.0579 6.0021 5.9470 5.7864 5.5824 5.3893 5.2064 7.3255 7.0197 6.8028 6.7327 6.6638 6.4632 6.2098 5.9713 5.7466 8.1622 7.7861 7.5208 74353 73513 71078 6.8017 6.5152 6.2469 8.9826 8.5302 8.2128 8.1109 8.0109 77217 7.3601 7.0236 6.7101 16.3514 14.8775 13.8962 13.5903 13.2944 12.4622 11.4699 10.5940 9.8181 9 10 20 Periods 9% 10% 11% 12% 13% 14% 15% 20% 25% 1 0.9174 0.9091 0.9009 0.8929 0.8550 0.8772 0.8696 0.8333 0.8000 2. 3 1.7591 1.7355 1.7125 1.6901 1.6681 1.6467 1.6257 1.5278 1.4400 2.5313 2.4869 2.4437 2.4018 2.3612 2.3216 2.2832 2.1065 1.9520 3.2397 3.1699 3.1024 3.0373 2.9745 2.9137 2.8550 2.5887 2.3616 3.8897 3.7908 3.6959 3.6048 3.5172 3.4331 3.3522 2.9906 2.6893 4 5 6 4.4859 4.3553 4.2305 4.1114 3.9975 3.8887 3.7845 3.3255 2.9514 7 5.0330 4.8684 4.7122 4.5638 4.4226 4.2883 4.1604 3.6046 3.1611 00 9 5.5348 5.3349 5.1461 4.9676 4.7988 4.6389 4.4873 3.8372 3.3289 5.9952 5.7590 5.5370 5.3282 5.1317 4.9464 4.7716 4.0310 3.4631 6.4177 6.1446 5.8892 5.6502 5.4262 5.2161 5.0188 4.1925 3.5705 10 20 9.1285 8.5136 7.9633 7.4694 70248 6.6231 6.2593 4.8696 3.9539 There is one payment each period
Step by Step Solution
There are 3 Steps involved in it

Get step-by-step solutions from verified subject matter experts