

Question: Both the files are to be done in the same file but seperated tab. create your own excel templates individually with the numbers given. Food
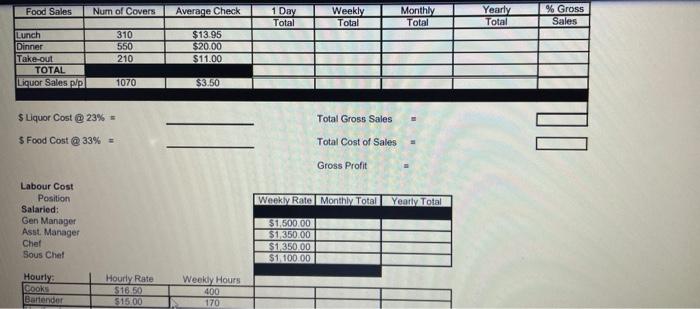
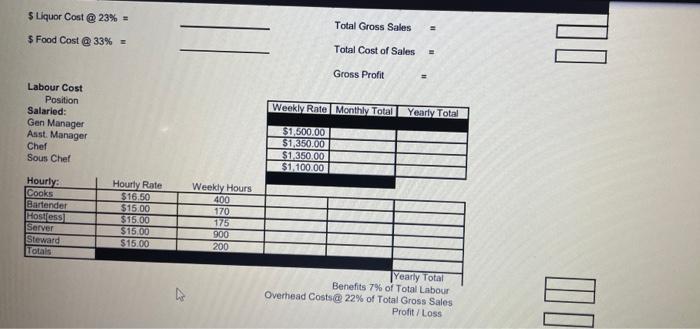
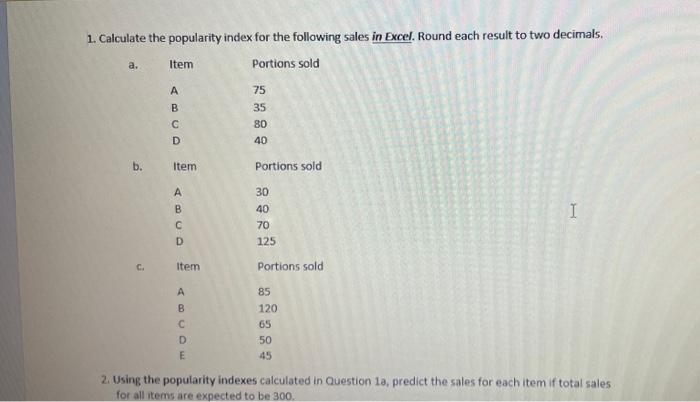
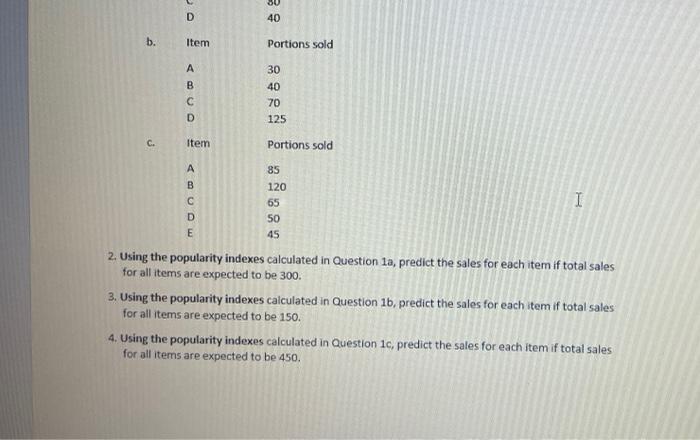
Food Sales Num of Covers Average Check 1 Day Total Weekly Total Monthly Total Yearly Total % Gross Sales Lunch Dinner Take-out TOTAL Liquor Sales pp 310 550 210 $13.95 $20.00 $11.00 1070 $3.50 Liquor Cost @ 23% Total Gross Sales S Food Cost @33% = Total Cost of Sales Gross Profit Weekly Rate Monthly Total Yearly Total Labour Cost Position Salaried: Gen Manager Asst. Manager Chef Sous Chef $1,500.00 $1,350.00 $1.350.00 $1,100.00 Hourly Cooks Bartender Hourly Rate $16.50 $15.00 Weekly Hours 400 170 Liquor Cost @ 23% $ Food Cost @33% = Total Gross Sales UO Total Cost of Sales E Gross Profit = Weekly Rate Monthly Total Yearly Total Labour Cost Position Salaried: Gen Manager Asst. Manager Chef Sous Chef $1,500.00 $1,350.00 $1.350.00 $1,100.00 Weekly Hours 400 Hourly Cooks Bartender Hostess Server Steward Totals Hourly Rate $16.50 $15.00 $15.00 $11.00 $15.00 170 175 900 200 Yearly Total Benefits 7% of Total Labour Overhead Costs@ 22% of Total Gross Sales Profit/Loss 1. Calculate the popularity index for the following sales in Excel. Round each result to two decimals. Item Portions sold a. A B C D OU 75 35 80 40 b. Item Portions sold B 30 40 70 125 1 D C. Item Portions sold A 85 120 65 50 45 2. Using the popularity indexes calculated in Question 1a, predict the sales for each item if total sales for all items are expected to be 300. D 00 40 b. Item Portions sold
Step by Step Solution
There are 3 Steps involved in it

Get step-by-step solutions from verified subject matter experts