

Question: Bottom saids Use the orange point (square symbol) to plot the data for Charles. Math & Graphing Skills Consider the following graph, which shows the
Bottom saids "Use the orange point (square symbol) to plot the data for Charles".
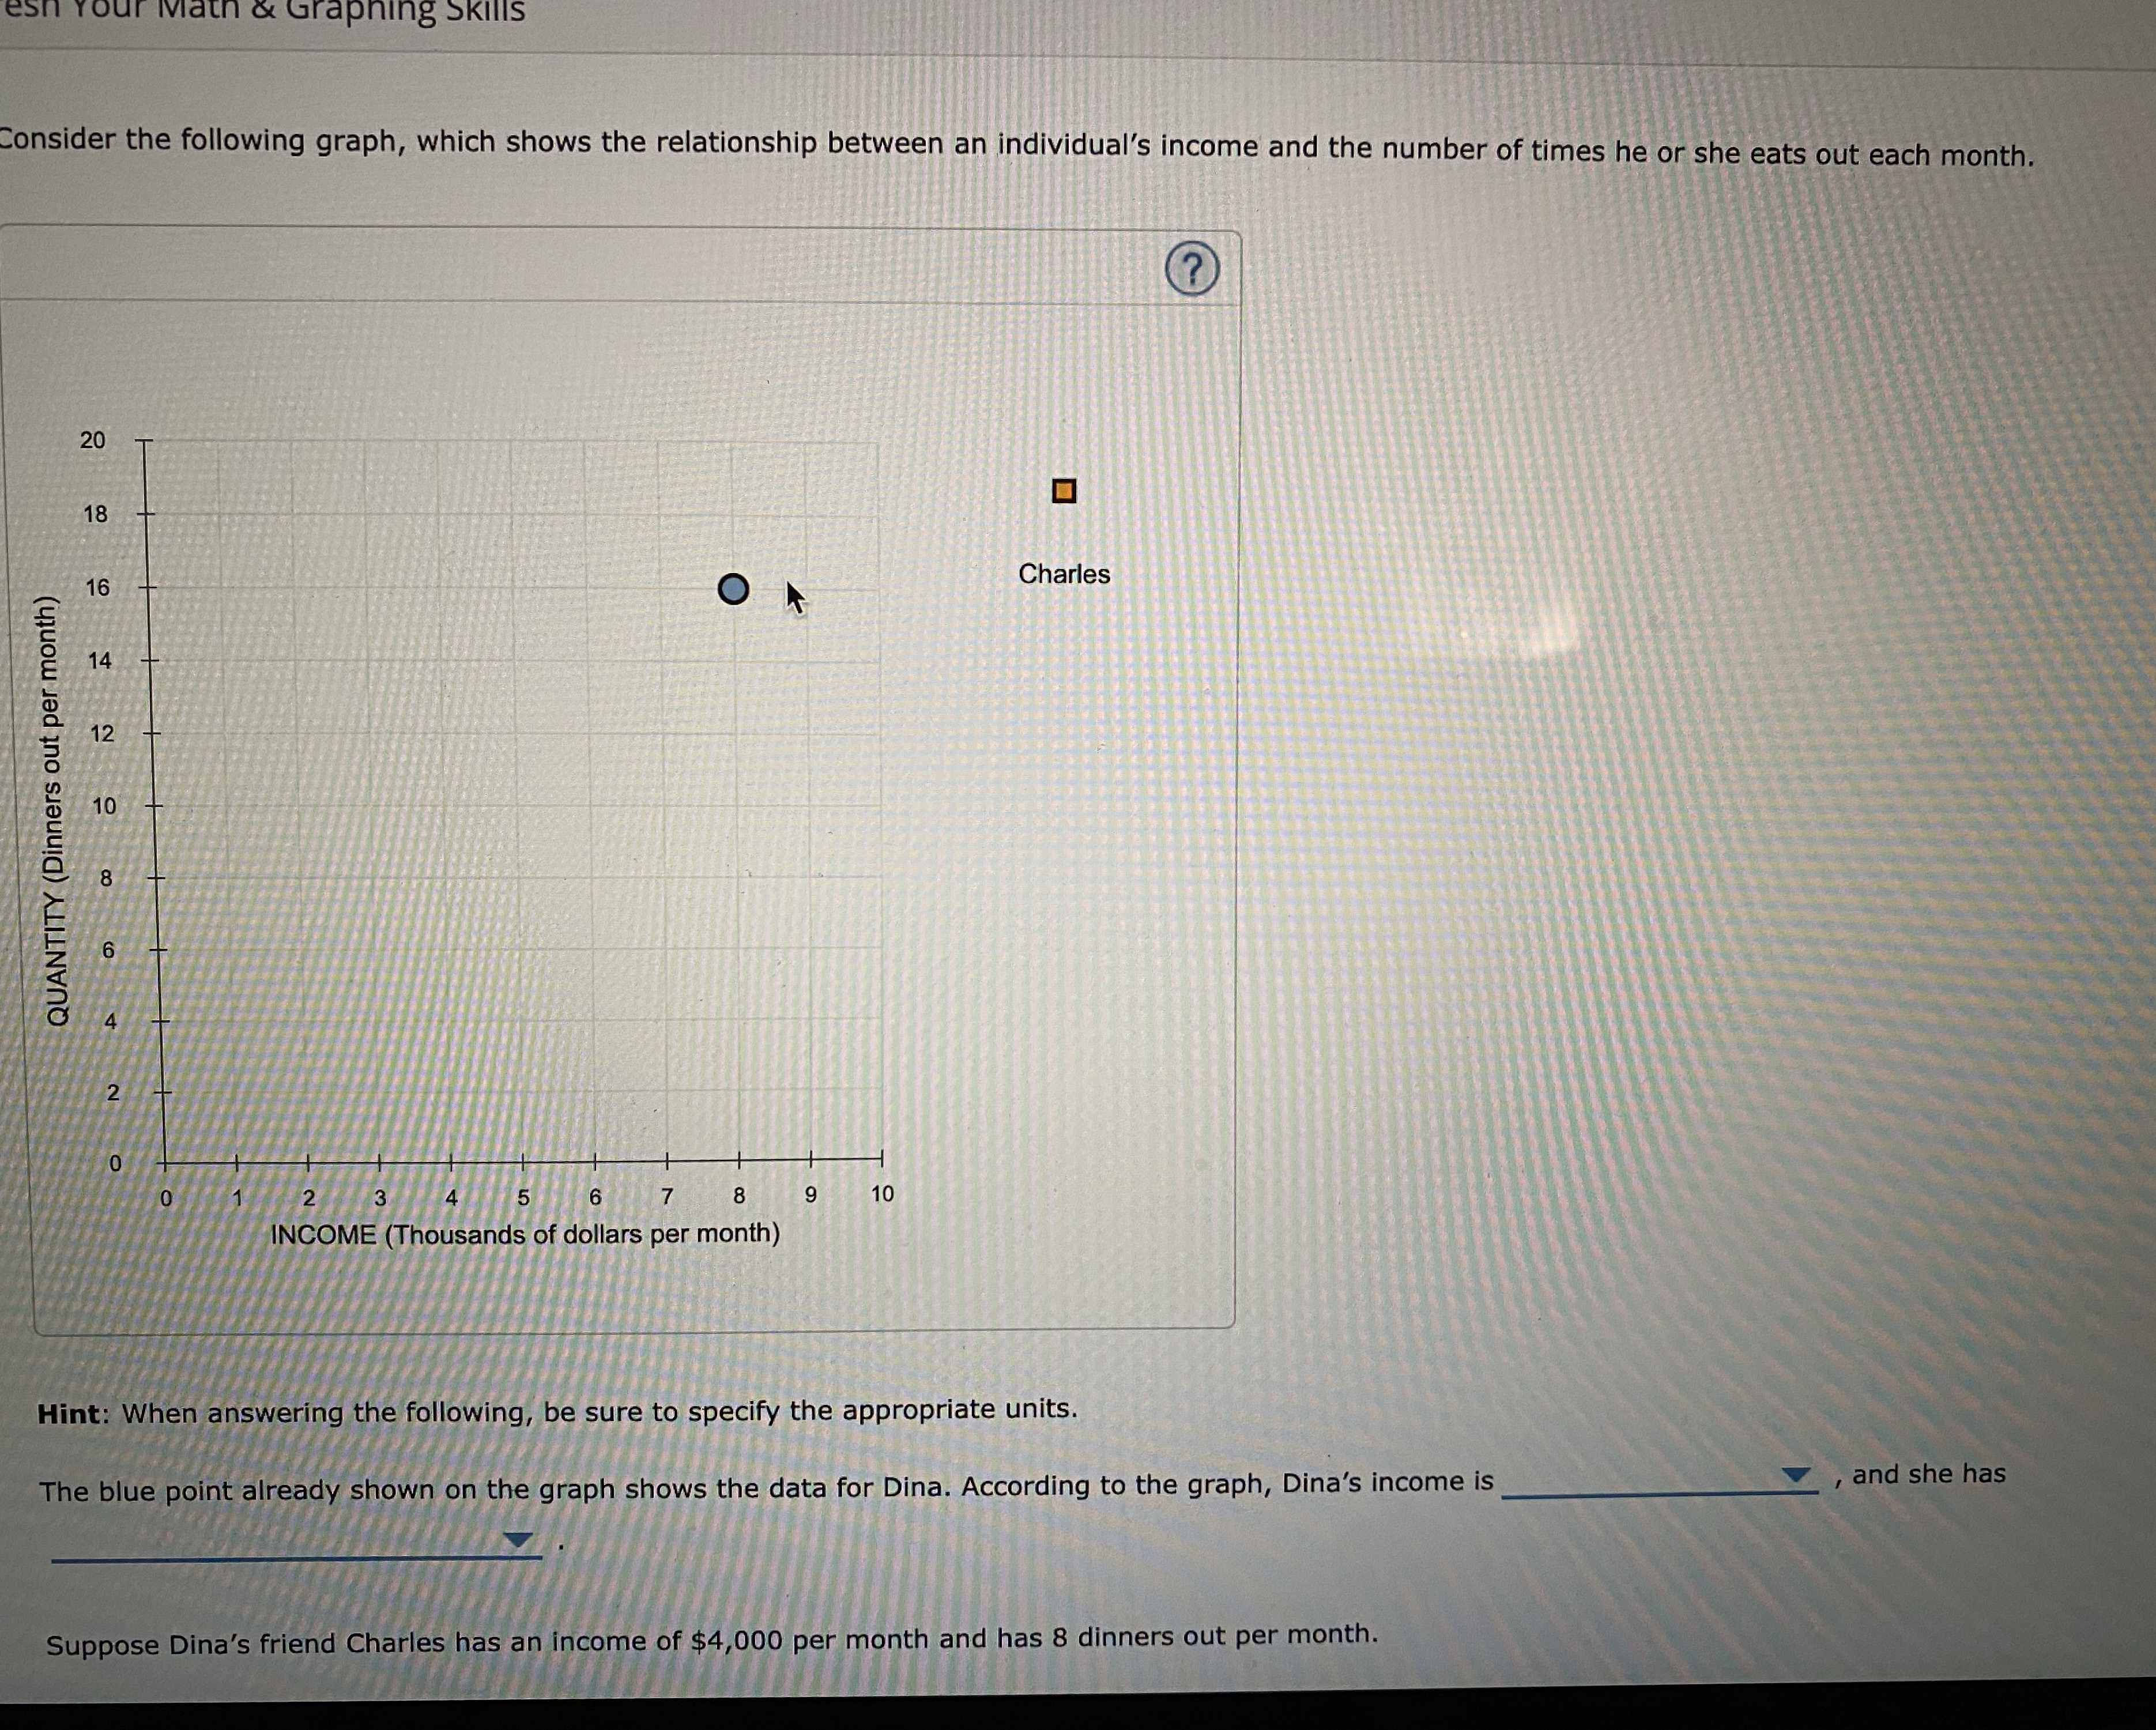
Math & Graphing Skills Consider the following graph, which shows the relationship between an individual's income and the number of times he or she eats out each month. 20 18 16 Charles 14 12 QUANTITY (Dinners out per month) 10 00 2 3 5 6 7 8 9 10 INCOME (Thousands of dollars per month) Hint: When answering the following, be sure to specify the appropriate units. The blue point already shown on the graph shows the data for Dina. According to the graph, Dina's income is , and she has Suppose Dina's friend Charles has an income of $4,000 per month and has 8 dinners out per month
Step by Step Solution
There are 3 Steps involved in it

Get step-by-step solutions from verified subject matter experts