

Question: Box - Parts shot Hyperlink Bookmark Crott-eference Header Footer Page Number Links Hender & Footer Cap Object Text Question 2: (65 points)..... The sales and
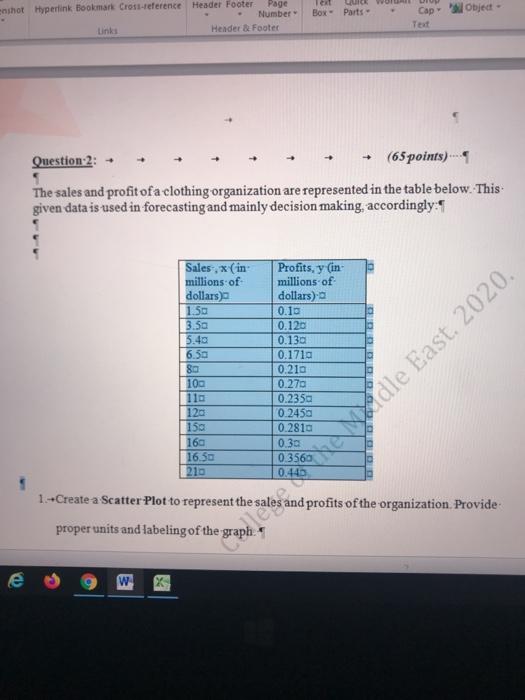
Box - Parts shot Hyperlink Bookmark Crott-eference Header Footer Page Number Links Hender & Footer Cap Object Text Question 2: (65 points)..... The sales and profit of a clothing organization are represented in the table below. This given data is used in forecasting and mainly decision making, accordingly.5 Sales, x (in millions of dollars) 1.50 3.50 5.40 6.50 80 100 110 120 150 160 16.50 210 Profits, y (in millions of dollars) 0.10 0.120 0.130 0.1710 0.210 0.270 0.2350 0.2450 0.2810 0.3a 0.3560 0.440 Idle East, 2020. 1.- Create a Scatter Plot to represent the sales and profits of the organization. Provide proper units and labeling of the graph. w
Step by Step Solution
There are 3 Steps involved in it

Get step-by-step solutions from verified subject matter experts