

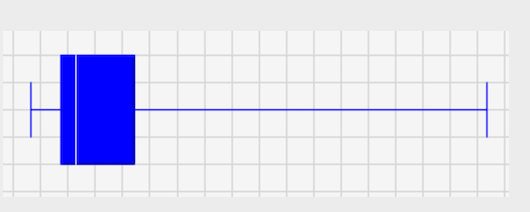
Question: boxplot represents a set of collected data and is drawn to scale. It is known that 50% of the data has values below 12 and
boxplot represents a set of collected data and is drawn to scale.
It is known that 50% of the data has values below 12 and 50% have values above 12.
the 25th percentile is 10.
\f
Step by Step Solution
There are 3 Steps involved in it
1 Expert Approved Answer
Step: 1 Unlock

Question Has Been Solved by an Expert!
Get step-by-step solutions from verified subject matter experts
Step: 2 Unlock
Step: 3 Unlock