

Question: Break even analysis implies that at some point in the operations, total revenue equals total cost. Break even analysis is concerned with finding the point
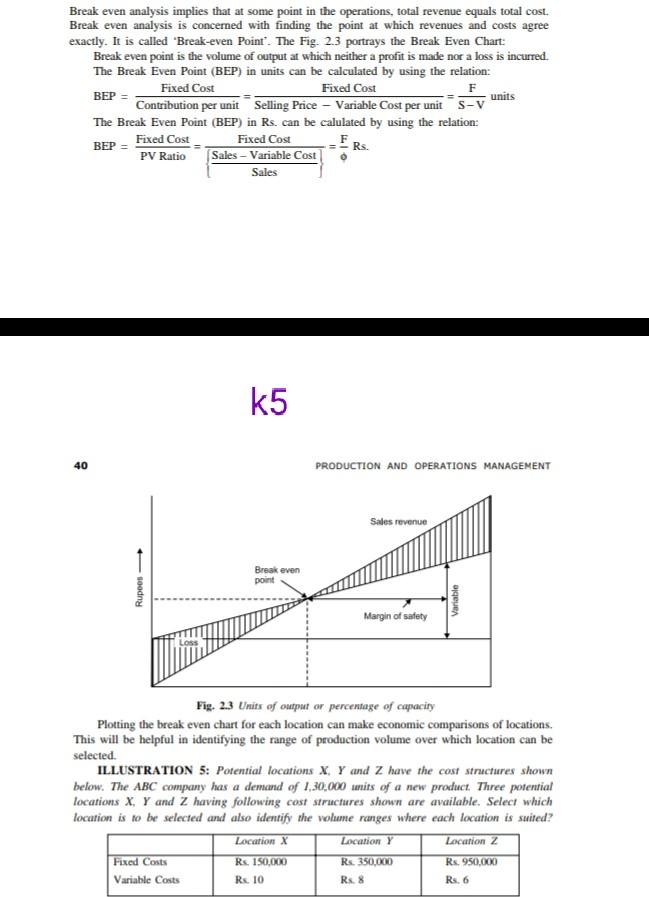
Break even analysis implies that at some point in the operations, total revenue equals total cost. Break even analysis is concerned with finding the point at which revenues and costs agree exactly. It is called "Break-even Point. The Fig. 2.3 portrays the Break Even Chart: Break even point is the volume of output at which neither a profit is made nor a loss is incurred. The Break Even Point (BEP) in units can be calculated by using the relation: BEP Fixed Cost F Fixed Cost units Contribution per unit Selling Price - Variable Cost per units-V The Break Even Point (BEP) in Rs. can be calulated by using the relation: BEP Fixed Cost Fixed Cost PV Ratio Sales - Variable Cost Sales E Rs. k5 40 PRODUCTION AND OPERATIONS MANAGEMENT Sales revenue Break even point Rupees Variable Margin of safety Fig. 23 Units of output or percentage of capacity Plotting the break even chart for each location can make economic comparisons of locations This will be helpful in identifying the range of production volume over which location can be selected. ILLUSTRATION 5: Potential locations X Y and Z have the cost structures shown below. The ABC company has a demand of 1,30,000 units of a new product. Three potential locations X, Y and Z having following cost structures shown are available. Select which location is to be selected and also identify the volume ranges where cach location is suited? Location X Location Y Location Z Fixed Costs Rs. 150.000 Rs. 350.000 Rs 8 Rs. 950.000 Rs. 6 Variable Costs Rs. 10
Step by Step Solution
There are 3 Steps involved in it
1 Expert Approved Answer
Step: 1 Unlock

Question Has Been Solved by an Expert!
Get step-by-step solutions from verified subject matter experts
Step: 2 Unlock
Step: 3 Unlock