

Question: Brief Exercise 14-6 Selected financial data for Tri Town Ltd. are shown below. 2017 $754,000 ,040,000 991,000 835,000 2,142,000 2,015,000 1,678,000 1,019,000 1,119,000 1,259,000 6,305,000
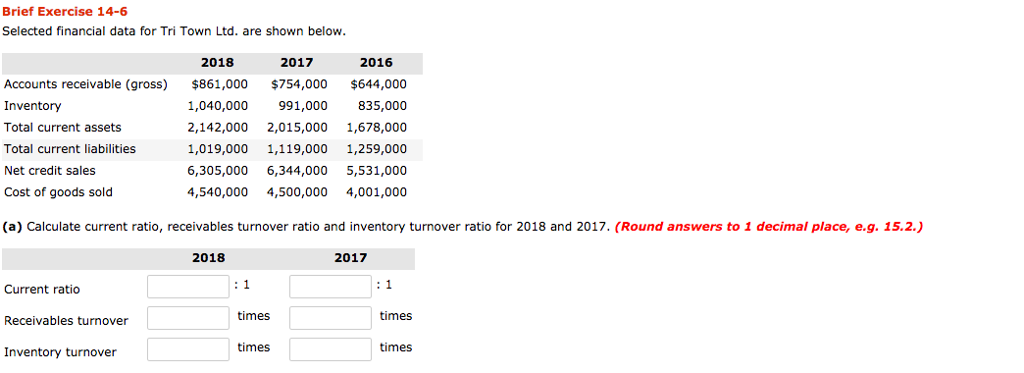
Brief Exercise 14-6 Selected financial data for Tri Town Ltd. are shown below. 2017 $754,000 ,040,000 991,000 835,000 2,142,000 2,015,000 1,678,000 1,019,000 1,119,000 1,259,000 6,305,000 6,344,000 5,531,000 4,540,000 4,500,000 4,001,000 2018 2016 Accounts receivable (gross) Inventory Total current assets Total current liabilities Net credit sales Cost of goods sold $861,000 $644,000 (a) Calculate current ratio, receivables turnover ratio and inventory turnover ratio for 2018 and 2017. (Round answers to 1 decimal place, e.g. 15.2.) 2018 2017 Current ratio Receivables turnover Inventory turnover times times times times
Step by Step Solution
There are 3 Steps involved in it
1 Expert Approved Answer
Step: 1 Unlock

Question Has Been Solved by an Expert!
Get step-by-step solutions from verified subject matter experts
Step: 2 Unlock
Step: 3 Unlock