

Question: Briefly analyze the common-sized income statement generated from NetAdvantage (one paragraph each). You should highlight the major components of each statement and note any significant
Briefly analyze the common-sized income statement generated from NetAdvantage (one paragraph each). You should highlight the major components of each statement and note any significant and specific changes in the composition of the balance sheet and income statement over the past few years.
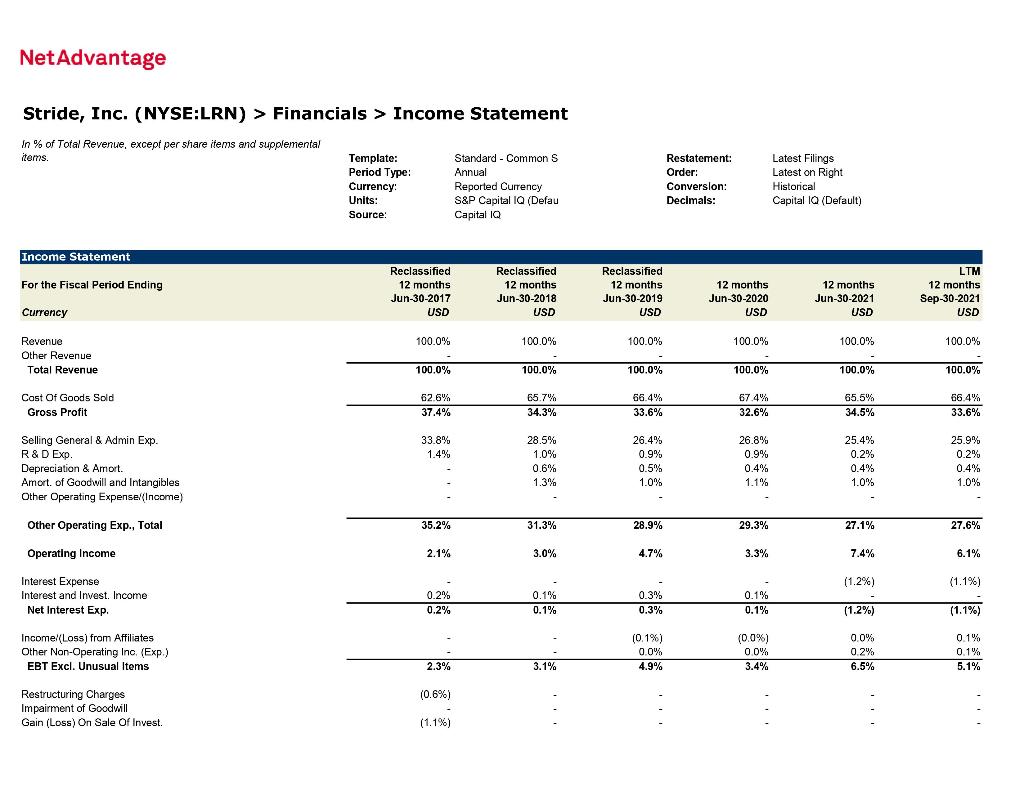
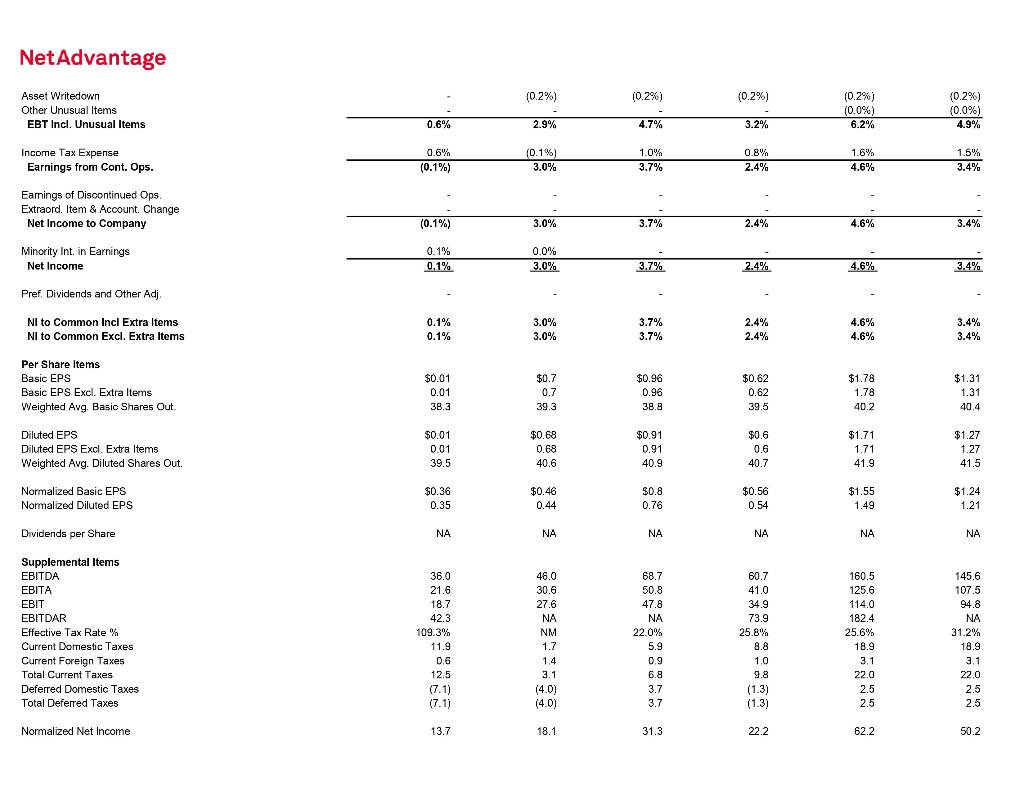
NetAdvantage Stride, Inc. (NYSE:LRN) > Financials > Income Statement in % of Total Revenue, except per share items and supplemental items. Template: Period Type: Currency Standard - Common S Annual Reported Currency S&P Capital IQ (Defau Capital 10 Restatement: Order: Conversion: Decimals: Latest Filings Latest on Right Historical Capital IQ (Default) Units: Source: Income Statement For the Fiscal Period Ending Reclassified 12 months Jun-30-2017 USD Reclassified 12 months Jun-30-2018 USD Reclassified 12 months Jun-30-2019 USD 12 months Jun-30-2020 USD 12 months Jun-30-2021 USD LTM 12 months Sep-30-2021 USD Currency 100.0% 100.0% 100.0% 100.0% 100.0% 100.0% Revenue Other Revenue Total Revenue 100.0% 100.0% 100.0% 100.0% 100.0% 100.0% Cast Of Goods Sold Gross Profit 62.6% 37.4% 65.7% 34.3% 66.4% 33.6% 67.4% 32.6% 65.5%. 34.5% 66.4% 33.6% 33.8% 1.4% Selling General & Admin Exp. R & D Exp. Depreciation & Amort. Amort. of Goodwill and Intangibles Other Operating Expense (Income) 28.5% 1.0% 0.6% 1.3% 26.4% 0.9% 0.5% 1.0% 26.8% 0.9% 0.4% 1.1% 25.4% 0.2% 0.4% 1.0% 25.9% 0.2% 0.4% 1.0% % Other Operating Exp., Total 35.2% 31.3% 28.9% 29.3% 27.1% 27.6% Operating Income 2.1% 3.0% 4.7% 3.3% 7.4% 6.1% (1.2%) (1.1%) Interest Expense Interest and Invest. Income Net Interest Exp. 0.2% 0.2% 0.1% 0.1% 0.3% 0.3% 0.1% 0.1% (1.2%) (1.1%) Income(Loss) from Affiliates Other Non-Operating Ino. (Exp.) EBT Excl. Unusual Items (0.1%) 0.0 4.9% (0.0%) 0 0% 3.4% 0.0% 0.2% 6.5% 0.1% 0.1% 5.1% 2.3% 3.1% (0.6%) Restructuring Charges Impairment of Goodwill Gain (Loss) On Sale Of Invest. (1.1%) NetAdvantage (0.2%) (0.2%) (0.2%) Asset Writedown Other Unusual Items EBT Incl. Unusual Items . (0.2%) (0.0%) 6.2% (0.2%) (0.0%) 4.9% 0.6% 2.9% 4.7% 3.2% Income Tax Expense Earnings from Cont. Ops. 0.6% (0.1%) (0.1%) 3.0% 1.0% 3.7% 0.8% 2.4% 1.6% 4.6% 1.5% 3.4% Earnings of Discontinued Ops Extraord. Item & Account Change Net Income to Company (0.1%) 3.0% 3.7% 2.4% 4.6% % 3.4% Minority Int. in Earnings Net Income 0.1% 0.1% 0.0% 3.0% 3.7% 2.4% 4.6% 3.4% Pref. Dividends and Other Adj. . NI to Common Incl Extra Items NI to Common Excl. Extra Items 0.1% 0.1% 3.0% 3.0% % 3.7% 3.7% 2.4% 2.4% 4.6% 4.6% 3.4% 3.4% Per Share Items Basic EPS Basic EPS Excl. Extra Items Weighted Avg. Basic Shares Out $0.01 0.01 38.3 $0.7 0.7 39.3 $0.96 0.96 38.9 $0.62 0.62 39.5 $1.78 1.78 40.2 $1.31 1.31 40.4 Diluted EPS Diluted EPS Excl. Extra Items Weighted Avg. Diluted Shares $0.01 0.01 39.5 $0.68 0.68 40.6 $0.91 0.91 40.9 $0.6 0.6 40.7 $1.71 1.71 41.9 $1.27 1.27 41.5 Normalized Basic EPS Normalized Diluted EPS $0.36 0.35 $0.46 0.44 $0.8 0.76 $0.56 0.54 $1.55 1.49 $1.24 1.21 Dividends per Share NA NA NA NA NA NA Supplemental Items EBITDA EBITA EBIT EBITDAR Effective Tax Rate % Current Domestic Taxes Current Foreign Taxes Total Current Taxes Deferred Domestic Taxes Total Deferred Taxes 36.0 21.6 18.7 42.3 109.3% 11.9 0.6 12.5 (7.1) (7.1) 46.0 30.6 27.6 NA NM 1.7 1.4 3.1 (4.0) (4.0) 68.7 50.8 47.8 NA 22.0% 5.9 0.9 6.8 3.7 3.7 60.7 41.0 34.9 73.9 25.8% 8.8 10 9.8 (1.3) (1.3) 160.5 125.6 114.0 182.4 25.6% 18.9 3.1 22.0 2.5 2.5 145.6 107.5 94.8 NA 31.2% 18.9 3.1 22.0 2.5 2.5 Normalized Net Income 13.7 18.1 31.3 22.2 62.2 50.2 NetAdvantage Stride, Inc. (NYSE:LRN) > Financials > Income Statement in % of Total Revenue, except per share items and supplemental items. Template: Period Type: Currency Standard - Common S Annual Reported Currency S&P Capital IQ (Defau Capital 10 Restatement: Order: Conversion: Decimals: Latest Filings Latest on Right Historical Capital IQ (Default) Units: Source: Income Statement For the Fiscal Period Ending Reclassified 12 months Jun-30-2017 USD Reclassified 12 months Jun-30-2018 USD Reclassified 12 months Jun-30-2019 USD 12 months Jun-30-2020 USD 12 months Jun-30-2021 USD LTM 12 months Sep-30-2021 USD Currency 100.0% 100.0% 100.0% 100.0% 100.0% 100.0% Revenue Other Revenue Total Revenue 100.0% 100.0% 100.0% 100.0% 100.0% 100.0% Cast Of Goods Sold Gross Profit 62.6% 37.4% 65.7% 34.3% 66.4% 33.6% 67.4% 32.6% 65.5%. 34.5% 66.4% 33.6% 33.8% 1.4% Selling General & Admin Exp. R & D Exp. Depreciation & Amort. Amort. of Goodwill and Intangibles Other Operating Expense (Income) 28.5% 1.0% 0.6% 1.3% 26.4% 0.9% 0.5% 1.0% 26.8% 0.9% 0.4% 1.1% 25.4% 0.2% 0.4% 1.0% 25.9% 0.2% 0.4% 1.0% % Other Operating Exp., Total 35.2% 31.3% 28.9% 29.3% 27.1% 27.6% Operating Income 2.1% 3.0% 4.7% 3.3% 7.4% 6.1% (1.2%) (1.1%) Interest Expense Interest and Invest. Income Net Interest Exp. 0.2% 0.2% 0.1% 0.1% 0.3% 0.3% 0.1% 0.1% (1.2%) (1.1%) Income(Loss) from Affiliates Other Non-Operating Ino. (Exp.) EBT Excl. Unusual Items (0.1%) 0.0 4.9% (0.0%) 0 0% 3.4% 0.0% 0.2% 6.5% 0.1% 0.1% 5.1% 2.3% 3.1% (0.6%) Restructuring Charges Impairment of Goodwill Gain (Loss) On Sale Of Invest. (1.1%) NetAdvantage (0.2%) (0.2%) (0.2%) Asset Writedown Other Unusual Items EBT Incl. Unusual Items . (0.2%) (0.0%) 6.2% (0.2%) (0.0%) 4.9% 0.6% 2.9% 4.7% 3.2% Income Tax Expense Earnings from Cont. Ops. 0.6% (0.1%) (0.1%) 3.0% 1.0% 3.7% 0.8% 2.4% 1.6% 4.6% 1.5% 3.4% Earnings of Discontinued Ops Extraord. Item & Account Change Net Income to Company (0.1%) 3.0% 3.7% 2.4% 4.6% % 3.4% Minority Int. in Earnings Net Income 0.1% 0.1% 0.0% 3.0% 3.7% 2.4% 4.6% 3.4% Pref. Dividends and Other Adj. . NI to Common Incl Extra Items NI to Common Excl. Extra Items 0.1% 0.1% 3.0% 3.0% % 3.7% 3.7% 2.4% 2.4% 4.6% 4.6% 3.4% 3.4% Per Share Items Basic EPS Basic EPS Excl. Extra Items Weighted Avg. Basic Shares Out $0.01 0.01 38.3 $0.7 0.7 39.3 $0.96 0.96 38.9 $0.62 0.62 39.5 $1.78 1.78 40.2 $1.31 1.31 40.4 Diluted EPS Diluted EPS Excl. Extra Items Weighted Avg. Diluted Shares $0.01 0.01 39.5 $0.68 0.68 40.6 $0.91 0.91 40.9 $0.6 0.6 40.7 $1.71 1.71 41.9 $1.27 1.27 41.5 Normalized Basic EPS Normalized Diluted EPS $0.36 0.35 $0.46 0.44 $0.8 0.76 $0.56 0.54 $1.55 1.49 $1.24 1.21 Dividends per Share NA NA NA NA NA NA Supplemental Items EBITDA EBITA EBIT EBITDAR Effective Tax Rate % Current Domestic Taxes Current Foreign Taxes Total Current Taxes Deferred Domestic Taxes Total Deferred Taxes 36.0 21.6 18.7 42.3 109.3% 11.9 0.6 12.5 (7.1) (7.1) 46.0 30.6 27.6 NA NM 1.7 1.4 3.1 (4.0) (4.0) 68.7 50.8 47.8 NA 22.0% 5.9 0.9 6.8 3.7 3.7 60.7 41.0 34.9 73.9 25.8% 8.8 10 9.8 (1.3) (1.3) 160.5 125.6 114.0 182.4 25.6% 18.9 3.1 22.0 2.5 2.5 145.6 107.5 94.8 NA 31.2% 18.9 3.1 22.0 2.5 2.5 Normalized Net Income 13.7 18.1 31.3 22.2 62.2 50.2
Step by Step Solution
There are 3 Steps involved in it

Get step-by-step solutions from verified subject matter experts