

Question: Briefly explain the following elapsed time (duration) versus work time (labor) graph. Labor 10 L = D L = 0.75D 8 6 33% unplanned interruptions

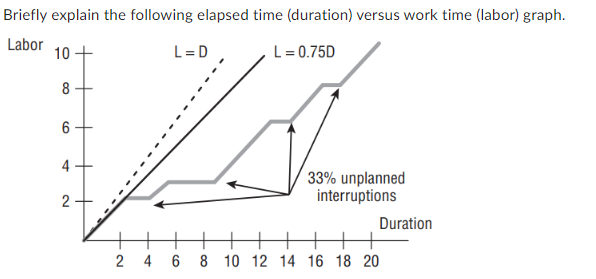
Briefly explain the following elapsed time (duration) versus work time (labor) graph. Labor 10 L = D L = 0.75D 8 6 33% unplanned interruptions Duration 2 4 6 8 10 12 14 16 18 20
Step by Step Solution
There are 3 Steps involved in it
1 Expert Approved Answer
Step: 1 Unlock

Question Has Been Solved by an Expert!
Get step-by-step solutions from verified subject matter experts
Step: 2 Unlock
Step: 3 Unlock