

Question: Bryan Singler is evaluating results for three separate business segments under his control. Selected financial information for each segment follows: Operating Income Average Assets Sales
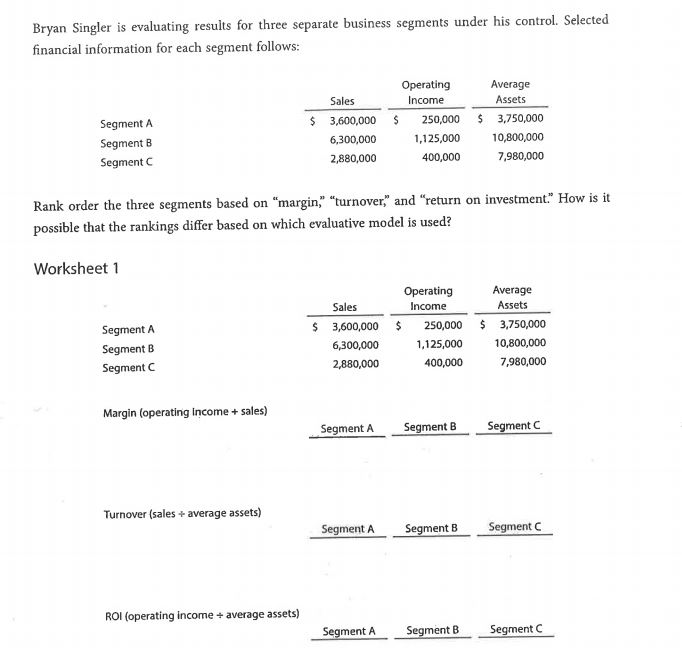
Bryan Singler is evaluating results for three separate business segments under his control. Selected financial information for each segment follows: Operating Income Average Assets Sales Segment A Segment B Segment C 3,600,000 250,000 3,750,000 10,800,000 7,980,000 6,300,000 2,880,000 1,125,000 400,000 Rank order the three segments based on "margin," "turnover," and "return on investment" How is it possible that the rankings differ based on which evaluative model is used? Worksheet 1 Operating Average Sales IncomeASse Segment A Segment B Segment C $3,600,000 250,000 3,750,000 10,800,000 7,980,000 6,300,000 2,880,000 1,125,000 400,000 Margin (operating income+sales) Segment ASegmentSegment C Turnover (sales + average assets) SegmentA ent B ROI (operating income+ average assets) Segment A Segment B Segment C
Step by Step Solution
There are 3 Steps involved in it

Get step-by-step solutions from verified subject matter experts