

Question: bsat mean control please explain how to do this this is all the information Using the sampling data from MEANCONTROL.xIsx, complete the following tasks or
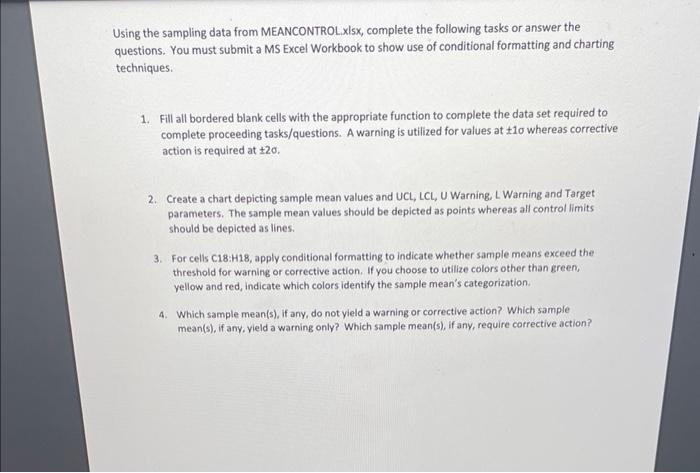
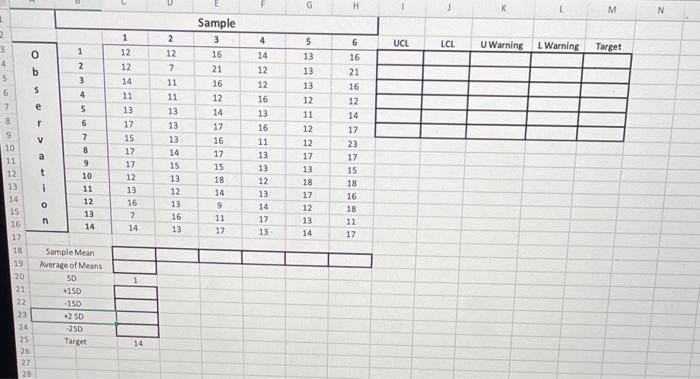
Using the sampling data from MEANCONTROL.xIsx, complete the following tasks or answer the questions. You must submit a MS Excel Workbook to show use of conditional formatting and charting techniques. 1. Fill all bordered blank cells with the appropriate function to complete the data set required to complete proceeding tasks/questions. A warning is utilized for values at 1 whereas corrective action is required at 20. 2. Create a chart depicting sample mean values and UCL, LCL, U Warning, L Warning and Target parameters. The sample mean values should be depicted as points whereas all control limits should be depicted as lines. 3. For cells C18:H18, apply conditional formatting to indicate whether sample means exceed the threshold for warning or corrective action. If you choose to utilize colors other than green, yellow and red, indicate which colors identify the sample mean's categorization. 4. Which sample mean(s), if any, do not yield a warning or corrective action? Which sample mean(s), if any, yield a warning only? Which sample mean(s), if any, require corrective action? Using the sampling data from MEANCONTROL.xIsx, complete the following tasks or answer the questions. You must submit a MS Excel Workbook to show use of conditional formatting and charting techniques. 1. Fill all bordered blank cells with the appropriate function to complete the data set required to complete proceeding tasks/questions. A warning is utilized for values at 1 whereas corrective action is required at 20. 2. Create a chart depicting sample mean values and UCL, LCL, U Warning, L Warning and Target parameters. The sample mean values should be depicted as points whereas all control limits should be depicted as lines. 3. For cells C18:H18, apply conditional formatting to indicate whether sample means exceed the threshold for warning or corrective action. If you choose to utilize colors other than green, yellow and red, indicate which colors identify the sample mean's categorization. 4. Which sample mean(s), if any, do not yield a warning or corrective action? Which sample mean(s), if any, yield a warning only? Which sample mean(s), if any, require corrective action
Step by Step Solution
There are 3 Steps involved in it

Get step-by-step solutions from verified subject matter experts