

Question: BUDGETING FOR GENERAL FOUNDRY Let us apply this budgeting process to t problem. The Gantt chart for this problem, shown in Figure 12.9, illustrate chart,
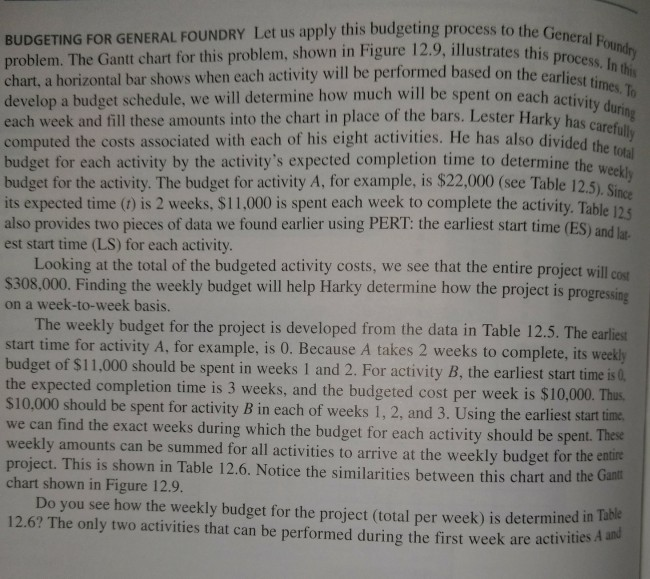
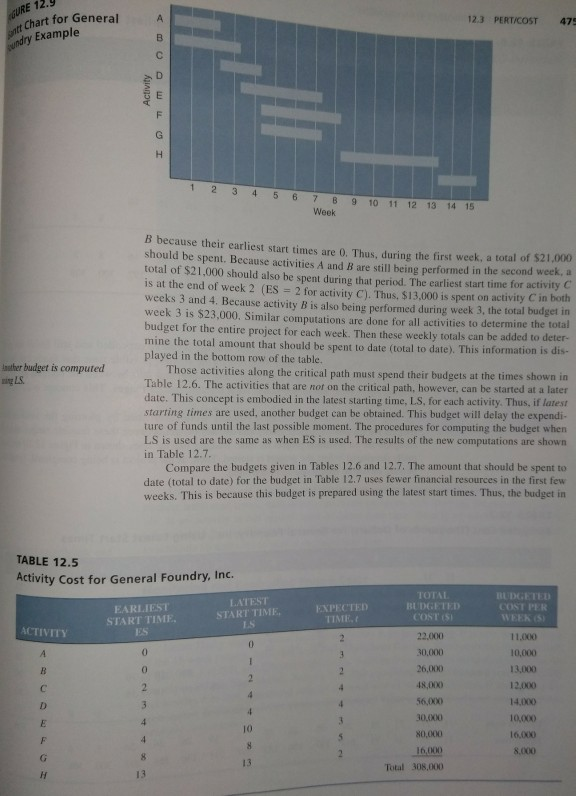
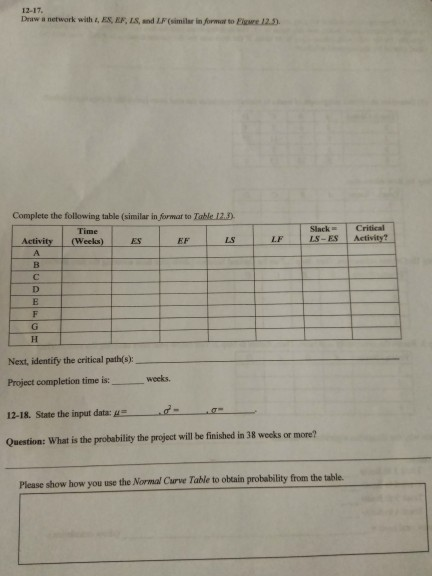
BUDGETING FOR GENERAL FOUNDRY Let us apply this budgeting process to t problem. The Gantt chart for this problem, shown in Figure 12.9, illustrate chart, a horizontal bar shows when each activity will be performed based on the earlis develop a budget schedule, we will determine how much will be spent on each activi each week and fill these amounts into the chart in place of the bars. Lester Harky has caret computed the costs associated with each of his eight activities. He has also divided th budget for each activity by the activity's expected completion time to determine the week budget for the activity. The budget for activity A, for example, is $22,000 (see Table 12.5 its expected time (0) is 2 weeks, $11,000 is spent each week to complete the activity. Table 12 also provides two pieces of data we found earlier using PERT: the earliest start time (ES) and the General Foundry s this proce this process, In thi total nice est start time (LS) for each activity. Looking at the total of the budgeted activity costs, we see that the entire project will $308,000. Finding the weekly budget will help Harky determine how the project is progressing on a week-to-week basis. The weekly budget for the project is developed from the data in Table 12.5. The earliest budget of $11,000 should be spent in weeks 1 and 2. For activity B, the earliest S10,000 should be spe start time for activity A, for example, is 0. Because A takes 2 weeks to complete, its weekly start time is the expected completion time is 3 weeks, and the budgeted cost per week is $10,000. Thas nt for activity B in each of weeks 1, 2, and 3. Using the earliest start time can find the exact weeks during which the budget for each activity should be spent. These n be summed for all activities to arrive at the weekly budget for the entire weekly amounts ca project. This is shown in Table 12.6. Notice the similarities between this chart and the chart shown in Figure 12.9 Gant Do you see how the weekly budget for the project (total per week) is determine 12.6? The only two activities that can be performed during the first week are activities in Table A and URE 12.9 t Chart for GeneralA 12.3 PERT/COST 475 Example B. 1 23 4567 B 9 10 11 12 13 141 Week B because their earliest start times are 0. Thus, during the first week, a total of $21,000 should be spent. Because activities A and B are still being performed in the second week, a total of $21,000 should also be spent during that period. The earliest start time for activity is at the end of week 2 (ES 2 for activity C). Thus, $13,000 is spent on activity C in both weeks 3 and 4. Because activity B is also being performed during week 3, the total budget in week 3 is $23,000. Similar computations are done for all activities to determine the total budget for the entire project for each week. Then these weekly totals can be added to deter- mine the total amount that should be spent to date (total to date). This information is dis- played in the bottom row of the table. lawther budget is computed Those activities along the critical path must spend their budgets at the times shown in Table 12.6. The activities that are not on the critical path, however, can be started at a later date. This concept is embodied in the latest starting time, LS, for each activity. Thus, if latest starting times are used, another budget can be obtained. This budget will delay the expendi ture of funds until the last possible moment. The procedures for computing the budget when LS is used are the same as when ES is used. The esults of the new computations are shown in Table 12.7 Compare the budgets given in Tables 12.6 and 12.7. The amount that should be spent to date (total to date) for the budget in Table 12.7 uses fewer financial resources in the first few weeks. This is because this budget is prepared using the latest start times. Thus, the budget in TABLE 12.5 Activity Cost for General Foundry, Inc. EARLIEST START TIME LATEST START TIME EXPECTED TIME, TOTAL BUDGETED BUDGETED COST PER WEEK (S ACTIVITY 22,000 11,000 10,000 13,000 12.000 48,000 14,000 10.000 16,000 8,000 30,000 10 80,000 13 Total 308,000 13 12-17. Draw a network with &, EX, EF, LS, and L.F (similar in formar to Eise 12.3. Complete the following table (similar in formar to Table 12.3 SlackCritical ILS-ESI Time LS LF Activity? Activity (Weeks) Next, identify the critical path(s): Project completion time is 12-18. State the input data:d- Question: What is the probability the project will be finished in 38 weeks or more? weeks, Please show how you use the Normal Curve Table to obtain probability from the table. BUDGETING FOR GENERAL FOUNDRY Let us apply this budgeting process to t problem. The Gantt chart for this problem, shown in Figure 12.9, illustrate chart, a horizontal bar shows when each activity will be performed based on the earlis develop a budget schedule, we will determine how much will be spent on each activi each week and fill these amounts into the chart in place of the bars. Lester Harky has caret computed the costs associated with each of his eight activities. He has also divided th budget for each activity by the activity's expected completion time to determine the week budget for the activity. The budget for activity A, for example, is $22,000 (see Table 12.5 its expected time (0) is 2 weeks, $11,000 is spent each week to complete the activity. Table 12 also provides two pieces of data we found earlier using PERT: the earliest start time (ES) and the General Foundry s this proce this process, In thi total nice est start time (LS) for each activity. Looking at the total of the budgeted activity costs, we see that the entire project will $308,000. Finding the weekly budget will help Harky determine how the project is progressing on a week-to-week basis. The weekly budget for the project is developed from the data in Table 12.5. The earliest budget of $11,000 should be spent in weeks 1 and 2. For activity B, the earliest S10,000 should be spe start time for activity A, for example, is 0. Because A takes 2 weeks to complete, its weekly start time is the expected completion time is 3 weeks, and the budgeted cost per week is $10,000. Thas nt for activity B in each of weeks 1, 2, and 3. Using the earliest start time can find the exact weeks during which the budget for each activity should be spent. These n be summed for all activities to arrive at the weekly budget for the entire weekly amounts ca project. This is shown in Table 12.6. Notice the similarities between this chart and the chart shown in Figure 12.9 Gant Do you see how the weekly budget for the project (total per week) is determine 12.6? The only two activities that can be performed during the first week are activities in Table A and URE 12.9 t Chart for GeneralA 12.3 PERT/COST 475 Example B. 1 23 4567 B 9 10 11 12 13 141 Week B because their earliest start times are 0. Thus, during the first week, a total of $21,000 should be spent. Because activities A and B are still being performed in the second week, a total of $21,000 should also be spent during that period. The earliest start time for activity is at the end of week 2 (ES 2 for activity C). Thus, $13,000 is spent on activity C in both weeks 3 and 4. Because activity B is also being performed during week 3, the total budget in week 3 is $23,000. Similar computations are done for all activities to determine the total budget for the entire project for each week. Then these weekly totals can be added to deter- mine the total amount that should be spent to date (total to date). This information is dis- played in the bottom row of the table. lawther budget is computed Those activities along the critical path must spend their budgets at the times shown in Table 12.6. The activities that are not on the critical path, however, can be started at a later date. This concept is embodied in the latest starting time, LS, for each activity. Thus, if latest starting times are used, another budget can be obtained. This budget will delay the expendi ture of funds until the last possible moment. The procedures for computing the budget when LS is used are the same as when ES is used. The esults of the new computations are shown in Table 12.7 Compare the budgets given in Tables 12.6 and 12.7. The amount that should be spent to date (total to date) for the budget in Table 12.7 uses fewer financial resources in the first few weeks. This is because this budget is prepared using the latest start times. Thus, the budget in TABLE 12.5 Activity Cost for General Foundry, Inc. EARLIEST START TIME LATEST START TIME EXPECTED TIME, TOTAL BUDGETED BUDGETED COST PER WEEK (S ACTIVITY 22,000 11,000 10,000 13,000 12.000 48,000 14,000 10.000 16,000 8,000 30,000 10 80,000 13 Total 308,000 13 12-17. Draw a network with &, EX, EF, LS, and L.F (similar in formar to Eise 12.3. Complete the following table (similar in formar to Table 12.3 SlackCritical ILS-ESI Time LS LF Activity? Activity (Weeks) Next, identify the critical path(s): Project completion time is 12-18. State the input data:d- Question: What is the probability the project will be finished in 38 weeks or more? weeks, Please show how you use the Normal Curve Table to obtain probability from the table
Step by Step Solution
There are 3 Steps involved in it

Get step-by-step solutions from verified subject matter experts