

Question: Build a Model 3 Chapter: Problem: 15 Joshua & White Technologies: December 31 Balance Sheets (Thousands of Dollars) Assets Cash and cash equivalents Short-term investments
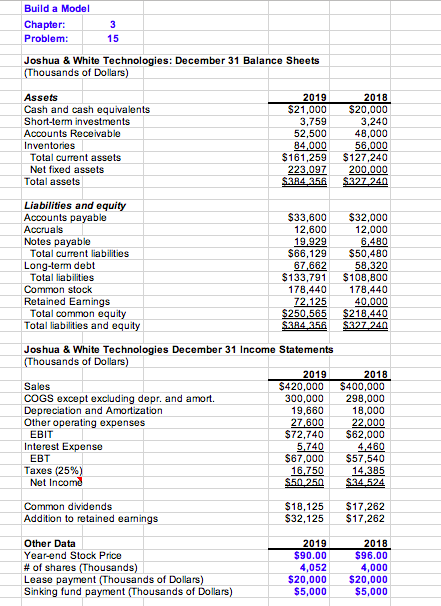
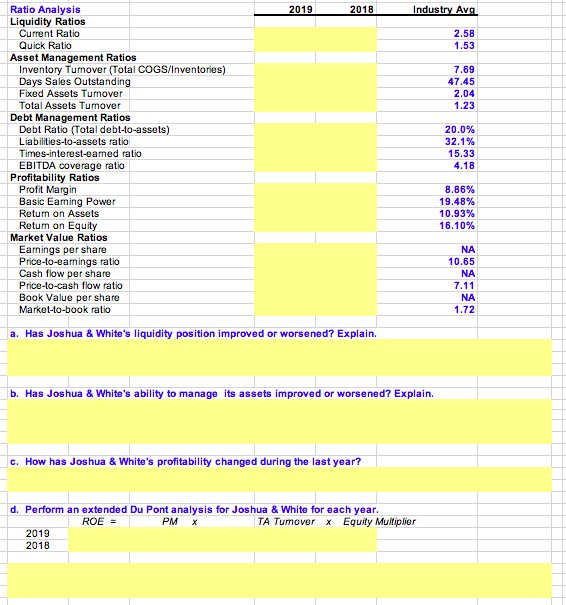
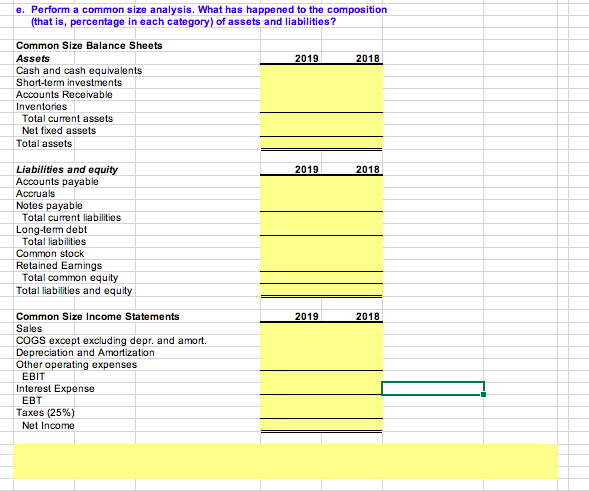
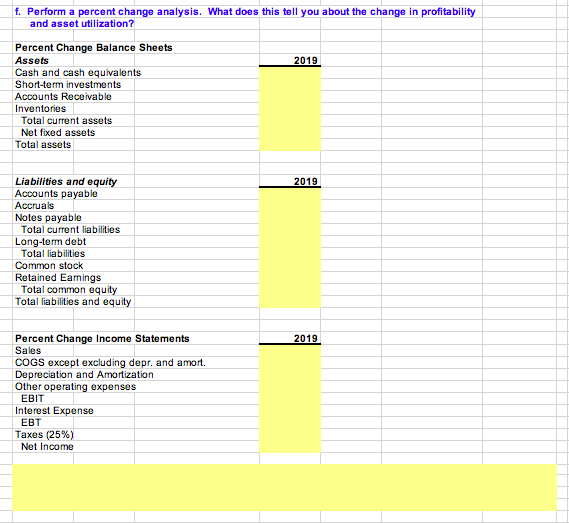
Build a Model 3 Chapter: Problem: 15 Joshua & White Technologies: December 31 Balance Sheets (Thousands of Dollars) Assets Cash and cash equivalents Short-term investments Accounts Receivable 2019 $21,000 3,759 52,500 84,000 $161,259 223,097 $384 358 2018 $20,000 3,240 48,000 56,000 $127.240 200,000 $327,240 Inventories Total current assets Net fixed assets Total assets Liabilities and equity Accounts payable Accruals Notes payable Total current liabilities Long-term debt Total liabilities Common stock Retained Earnings Total common equity Total liabilities and equity $33,600 12,600 19.929 $66,129 67,662 $133,791 178,440 72,125 $250 565 $384 356 $32,000 12,000 6,480 $50,480 58,320 $108,800 178,440 40,000 $218.440 $327 240 Joshua & White Technologies December 31 Income Statements (Thousands of Dollars) 2019 Sales $420,000 COGS except excluding depr. and amort. 300,000 Depreciation and Amortization 19,660 Other operating expenses 27,600 EBIT $72,740 Interest Expense 5,740 EBT $67.000 Taxos (25%) 16.750 Net Incomd $50 250 2018 $400,000 298,000 18,000 22.000 $62,000 4,460 $57,540 14,385 $34.524 Common dividends Addition to retained earnings $18,125 $32,125 $17,262 $17,262 Other Data Year-end Stock Price # of shares (Thousands) Lease payment (Thousands of Dollars) Sinking fund payment (Thousands of Dollars) 2019 $90.00 4,052 $20,000 $5,000 2018 $96.00 4,000 $20,000 $5,000 2019 2018 Industry Avg 2.58 1.53 Ratio Analysis Liquidity Ratios Current Ratio Quick Ratio Asset Management Ratios Inventory Turnover (Total COGS/Inventories) Days Sales Outstanding Fixed Assets Turnover 7.69 47.45 2.04 Total Assets Turnover 1.23 Debt Management Ratios Debt Ratio (Total debt-to-assets) Liabilities-to-assets ratio 20.0% 32.1% 15.33 Times-interest-earned ratio 4.18 8.86% 19.48% 10.93% 16.10% EBITDA coverage ratio Profitability Ratios Profit Margin Basic Earning Power Return on Assets Return on Equity Market Value Ratios Earnings per share Price-to-earnings ratio Cash flow por share Price-to-cash flow ratio Book Value per share Market-to-book ratio NA 10.65 NA 7.11 NA 1.72 a. Has Joshua & White's liquidity position improved or worsened? Explain. b. Has Joshua & White's ability to manage its assets improved or worsened? Explain. C. How has Joshua & White's profitability changed during the last year? d. Perform an extended Du Pont analysis for Joshua & White for each year. ROE - PM x TA Tumover X Equity Multiplier 2019 2018 e. Perform a common size analysis. What has happened to the composition (that is, percentage in each category) of assets and liabilities? 2019 2018 Common Size Balance Sheets Assets Cash and cash equivalents Short-term investments Accounts Receivable Inventories Total current assets Net fixed assets Total assets 2019 2018 Liabilities and equity Accounts payable Accruals Notes payable Total current liabilities Long-term debt Total liabilities Common stock Retained Earnings Total common equity Total liabilities and equity 2019 2018 Common Size Income Statements Sales COGS except excluding depr. and amort. Depreciation and Amortization Other operating expenses EBIT Interest Expense EBT Taxes (25%) Net Income f. Perform a percent change analysis. What does this tell you about the change in profitability and asset utilization? Percent Change Balance Sheets Assets Cash and cash equivalents Short-term investments 2019 Accounts Receivable Inventories Total current assets Net fixed assets Total assets 2019 Liabilities and equity Accounts payable Accruals Notes payable Total current liabilities Long-term debt Total liabilities Common stock Retained Earnings Total common equity Total liabilities and equity 2019 Percent Change Income Statements Sales COGS except excluding depr. and amort. Depreciation and Amortization Other operating expenses EBIT Interest Expense EBT Taxes (25%) Net Income Build a Model 3 Chapter: Problem: 15 Joshua & White Technologies: December 31 Balance Sheets (Thousands of Dollars) Assets Cash and cash equivalents Short-term investments Accounts Receivable 2019 $21,000 3,759 52,500 84,000 $161,259 223,097 $384 358 2018 $20,000 3,240 48,000 56,000 $127.240 200,000 $327,240 Inventories Total current assets Net fixed assets Total assets Liabilities and equity Accounts payable Accruals Notes payable Total current liabilities Long-term debt Total liabilities Common stock Retained Earnings Total common equity Total liabilities and equity $33,600 12,600 19.929 $66,129 67,662 $133,791 178,440 72,125 $250 565 $384 356 $32,000 12,000 6,480 $50,480 58,320 $108,800 178,440 40,000 $218.440 $327 240 Joshua & White Technologies December 31 Income Statements (Thousands of Dollars) 2019 Sales $420,000 COGS except excluding depr. and amort. 300,000 Depreciation and Amortization 19,660 Other operating expenses 27,600 EBIT $72,740 Interest Expense 5,740 EBT $67.000 Taxos (25%) 16.750 Net Incomd $50 250 2018 $400,000 298,000 18,000 22.000 $62,000 4,460 $57,540 14,385 $34.524 Common dividends Addition to retained earnings $18,125 $32,125 $17,262 $17,262 Other Data Year-end Stock Price # of shares (Thousands) Lease payment (Thousands of Dollars) Sinking fund payment (Thousands of Dollars) 2019 $90.00 4,052 $20,000 $5,000 2018 $96.00 4,000 $20,000 $5,000 2019 2018 Industry Avg 2.58 1.53 Ratio Analysis Liquidity Ratios Current Ratio Quick Ratio Asset Management Ratios Inventory Turnover (Total COGS/Inventories) Days Sales Outstanding Fixed Assets Turnover 7.69 47.45 2.04 Total Assets Turnover 1.23 Debt Management Ratios Debt Ratio (Total debt-to-assets) Liabilities-to-assets ratio 20.0% 32.1% 15.33 Times-interest-earned ratio 4.18 8.86% 19.48% 10.93% 16.10% EBITDA coverage ratio Profitability Ratios Profit Margin Basic Earning Power Return on Assets Return on Equity Market Value Ratios Earnings per share Price-to-earnings ratio Cash flow por share Price-to-cash flow ratio Book Value per share Market-to-book ratio NA 10.65 NA 7.11 NA 1.72 a. Has Joshua & White's liquidity position improved or worsened? Explain. b. Has Joshua & White's ability to manage its assets improved or worsened? Explain. C. How has Joshua & White's profitability changed during the last year? d. Perform an extended Du Pont analysis for Joshua & White for each year. ROE - PM x TA Tumover X Equity Multiplier 2019 2018 e. Perform a common size analysis. What has happened to the composition (that is, percentage in each category) of assets and liabilities? 2019 2018 Common Size Balance Sheets Assets Cash and cash equivalents Short-term investments Accounts Receivable Inventories Total current assets Net fixed assets Total assets 2019 2018 Liabilities and equity Accounts payable Accruals Notes payable Total current liabilities Long-term debt Total liabilities Common stock Retained Earnings Total common equity Total liabilities and equity 2019 2018 Common Size Income Statements Sales COGS except excluding depr. and amort. Depreciation and Amortization Other operating expenses EBIT Interest Expense EBT Taxes (25%) Net Income f. Perform a percent change analysis. What does this tell you about the change in profitability and asset utilization? Percent Change Balance Sheets Assets Cash and cash equivalents Short-term investments 2019 Accounts Receivable Inventories Total current assets Net fixed assets Total assets 2019 Liabilities and equity Accounts payable Accruals Notes payable Total current liabilities Long-term debt Total liabilities Common stock Retained Earnings Total common equity Total liabilities and equity 2019 Percent Change Income Statements Sales COGS except excluding depr. and amort. Depreciation and Amortization Other operating expenses EBIT Interest Expense EBT Taxes (25%) Net Income
Step by Step Solution
There are 3 Steps involved in it

Get step-by-step solutions from verified subject matter experts