

Question: Build a table for tracking sales over one year (Jan 2023-Dec 2023) with separate columns for meat, seafood, and produce. This will just be the
Build a table for tracking sales over one year (Jan 2023-Dec 2023) with separate columns for meat, seafood, and produce. This will just be the randomized demand value for each item for each month. For this question, assume all demand is actually met (that is sales = demand) and there is no other inventory loss except through sales. (PLEASE USE EXCEL TO ANSWER THIS QUESTION PROVIDE FORMULAS AND STEP BY STEP EXPLANATIONS) 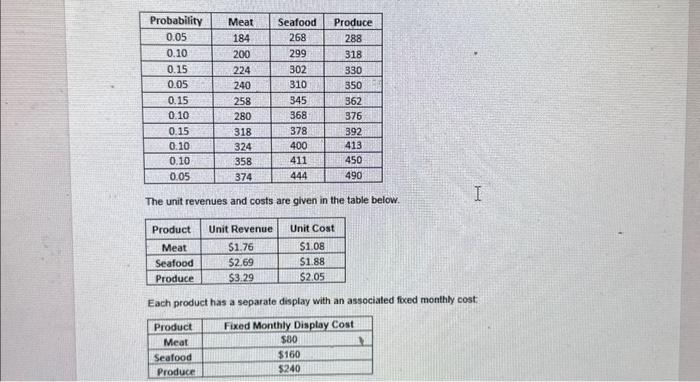
The unit revenues and costs are given in the table below. Each product has a separate display with an associaled foced monthly cost
Step by Step Solution
There are 3 Steps involved in it
1 Expert Approved Answer
Step: 1 Unlock

Question Has Been Solved by an Expert!
Get step-by-step solutions from verified subject matter experts
Step: 2 Unlock
Step: 3 Unlock