

Question: Build a two-stage dividend growth model using a 5-year first stage. Short term growth rate = 10.4% Long term growth rate = 5% Other information:
Build a two-stage dividend growth model using a 5-year first stage.
Short term growth rate = 10.4%
Long term growth rate = 5%
Other information: constant dividend growth model showed paying $1.21 dividends per stock with a discount rate of 12% and expected growth of 5%.
| Revenues: Net sales Other income -- net Total revenues Cost of goods sold Gross profit Expenses: Operating, selling, and general and administrative expenses Interest expenses -- net Total expenses Earnings (income) before taxes and minority interest Income tax Earnings (income) before minority interest Minority interest Earnings from discontinued operations (net of tax) Earnings after tax (net income) Average number of shares outstanding (millions) Net income per share | 2009 401,087 3,287 404,374 304,056 | 2010 405,046 3,168 408,214 304,657 |
| 100,318 77,520 1,900 79,420 20,898 7,145 13,753 - 499 146 13,400 3,939 $ 3.40 | 103,557 79,607 1,884 81,491 22,066 7,139 14,927 - 513 - 79 14,335 3,866 $ 3.71 |
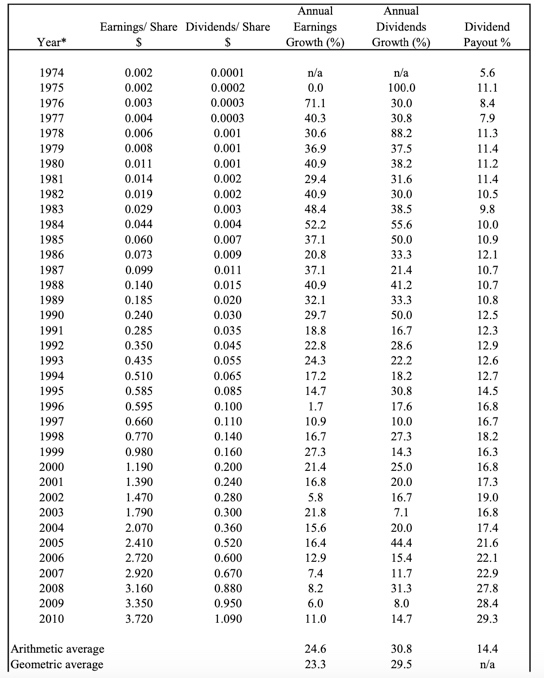
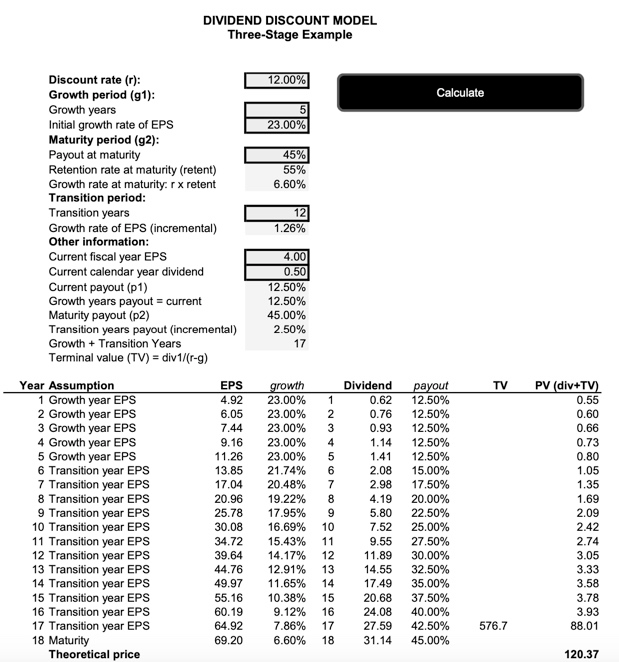
Earnings/ Share Dividends/ Share Annual Earnings Growth (%) Annual Dividends Growth (%) Dividend Payout % Year* 5.6 11.1 8.4 7.9 11.3 11.4 11.2 11.4 10.5 9.8 1974 1975 1976 1977 1978 1979 1980 1981 1982 1983 1984 1985 1986 1987 1988 1989 1990 1991 1992 1993 1994 1995 1996 1997 1998 1999 2000 2001 2002 2003 2004 2005 2006 2007 2008 2009 2010 10.0 10.9 12.1 10.7 10.7 10.8 0.002 0.002 0.003 0.004 0.006 0.008 0.011 0.014 0.019 0.029 0.044 0.060 0.073 0.099 0.140 0.185 0.240 0.285 0.350 0.435 0.510 0.585 0.595 0.660 0.770 0.980 1.190 1.390 1.470 1.790 2.070 2.410 2.720 2.920 3.160 3.350 3.720 n/a 0.0 71.1 40.3 30.6 36.9 40.9 29.4 40.9 48.4 52.2 37.1 20.8 37.1 40.9 32.1 29.7 18.8 22.8 24.3 17.2 14.7 1.7 10.9 16.7 27.3 21.4 12.5 0.0001 0.0002 0.0003 0.0003 0.001 0.001 0.001 0.002 0.002 0.003 0.004 0.007 0.009 0.011 0.015 0.020 0.030 0.035 0.045 0.055 0.065 0.085 0.100 0.110 0.140 0.160 0.200 0.240 0.280 0.300 0.360 0.520 0.600 0.670 0.880 0.950 1.090 n/a 100.0 30.0 30.8 88.2 37.5 38.2 31.6 30.0 38.5 55.6 50.0 33.3 21.4 41.2 33.3 50.0 16.7 28.6 22.2 18.2 30.8 17.6 10.0 27.3 12.3 12.9 12.6 12.7 14.5 16.8 16.7 18.2 16.3 16.8 17.3 19.0 16.8 17.4 16.8 5.8 21.8 15.6 16.4 12.9 7.4 14.3 25.0 20.0 16.7 7.1 20.0 44.4 15.4 11.7 31.3 8.0 14.7 8.2 6.0 11.0 29.3 Arithmetic average Geometric average 24.6 23.3 30.8 29.5 DIVIDEND DISCOUNT MODEL Three-Stage Example 12.00% Calculate 23.00% 45% 55% 6.60% Discount rate (c): Growth period (91): Growth years Initial growth rate of EPS Maturity period (92): Payout at maturity Retention rate at maturity (retent) Growth rate at maturity. r x retent Transition period: Transition years Growth rate of EPS (incremental) Other information: Current fiscal year EPS Current calendar year dividend Current payout (p1) Growth years payout = current Maturity payout (p2) Transition years payout (incremental) Growth + Transition Years Terminal value (TV) = div 1/(r-9) 12 1.26% 4.00 0.50 12.50% 12.50% 45.00% 2.50% TV 1 2 3 4 6 Year Assumption 1 Growth year EPS 2 Growth year EPS 3 Growth year EPS 4 Growth year EPS 5 Growth year EPS 6 Transition year EPS 7 Transition year EPS 8 Transition year EPS 9 Transition year EPS 10 Transition year EPS 11 Transition year EPS 12 Transition year EPS 13 Transition year EPS 14 Transition year EPS 15 Transition year EPS 16 Transition year EPS 17 Transition year EPS 18 Maturity Theoretical price EPS 4.92 6.05 7.44 9.16 11.26 13.85 17.04 20.96 25.78 30.08 34.72 39.64 44.76 49.97 55.16 60.19 64.92 69.20 growth 23.00% 23.00% 23.00% 23.00% 23.00% 21.74% 20.48% 19.22% 17.95% 16.69% 15.43% 14.17% 12.91% 11.65% 10.38% 9.12% 7.86% 6.60% 8 9 10 11 12 13 14 15 16 17 18 Dividend payout 0.62 12.50% 0.76 12.50% 0.93 12.50% 1.14 12.50% 1.41 12.50% 2.08 15.00% 2.98 17.50% 4.1920.00% 5.80 22.50% 7.52 25.00% 9.55 27.50% 11.89 30.00% 14.55 32.50% 17.49 35.00% 20.68 37.50% 24.08 40.00% 27.59 42.50% 31.14 45.00% PV (div+TV) 0.55 0.60 0.66 0.73 0.80 1.05 1.35 1.69 2.09 2.42 2.74 3.05 3.33 3.58 3.78 3.93 88.01 576.7 120.37
Step by Step Solution
There are 3 Steps involved in it

Get step-by-step solutions from verified subject matter experts