Question: Build differents sheets based on the instruction and given balance sheet. 0 Sheet 1: WACC Calculation 0 Equity Value 0 Debt Value (Refer to entry
Build differents sheets based on the instruction and given balance sheet.
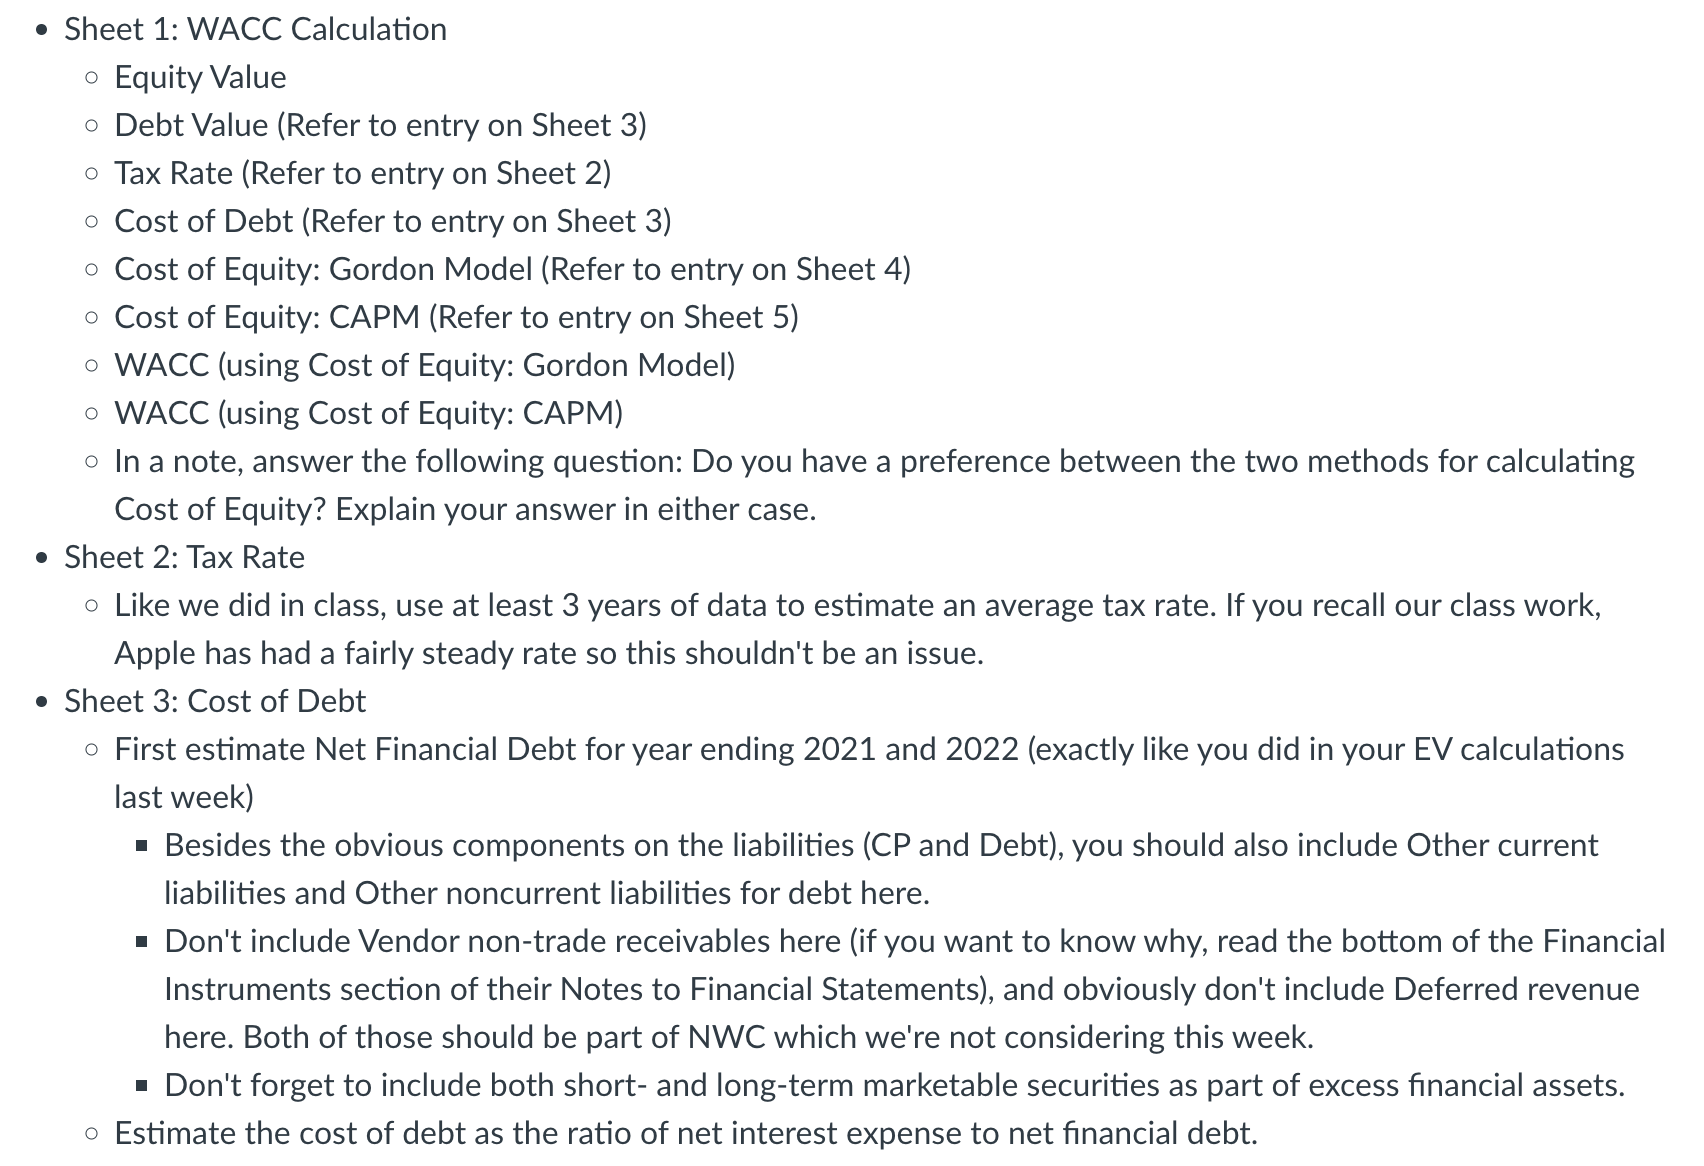
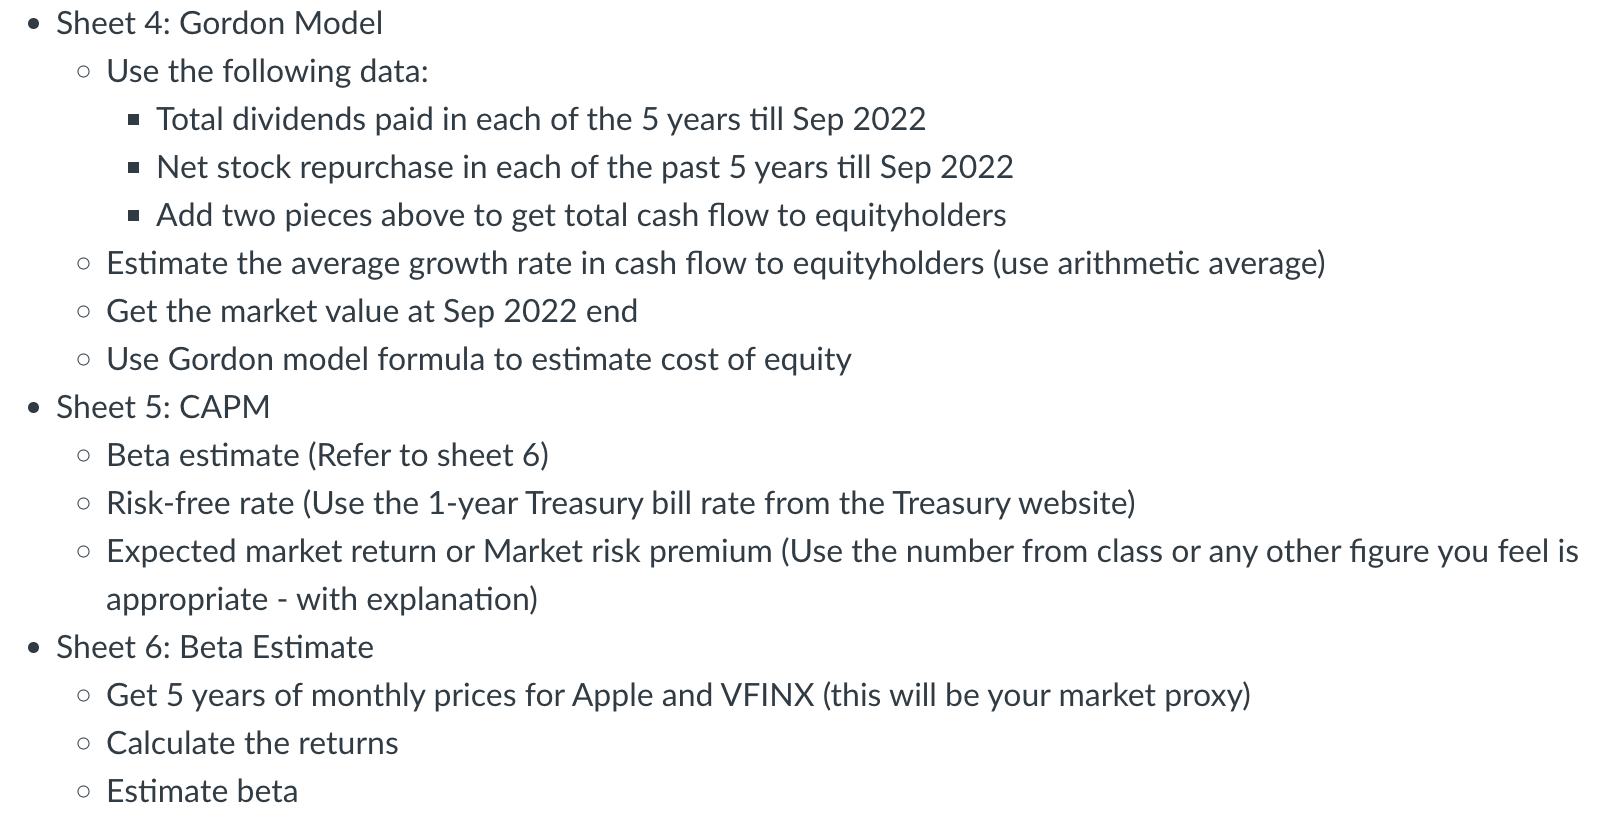
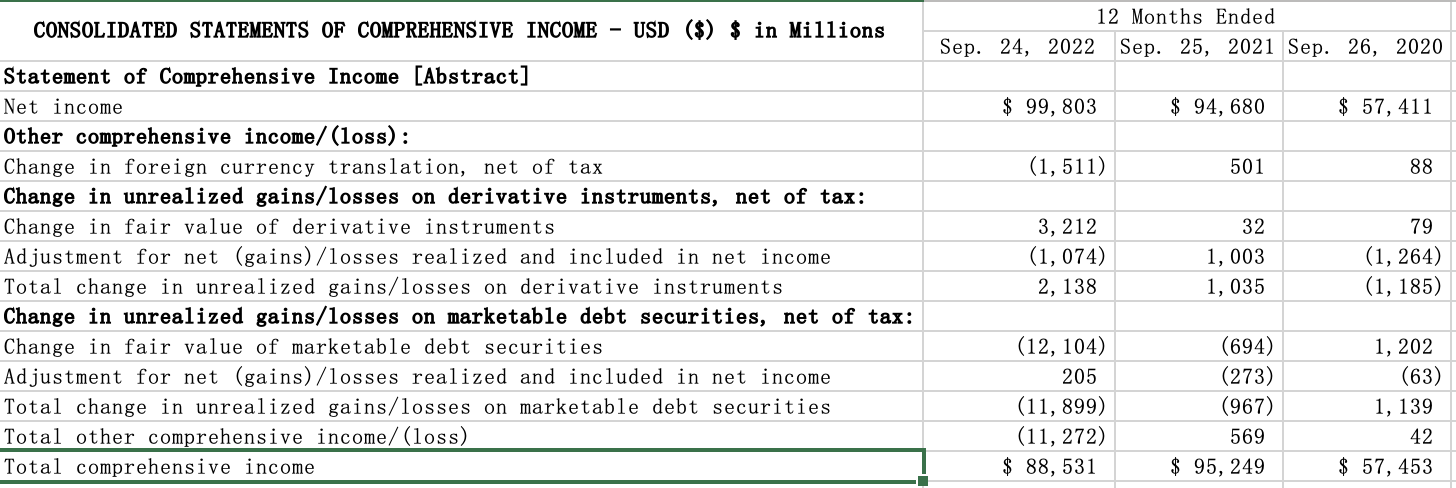
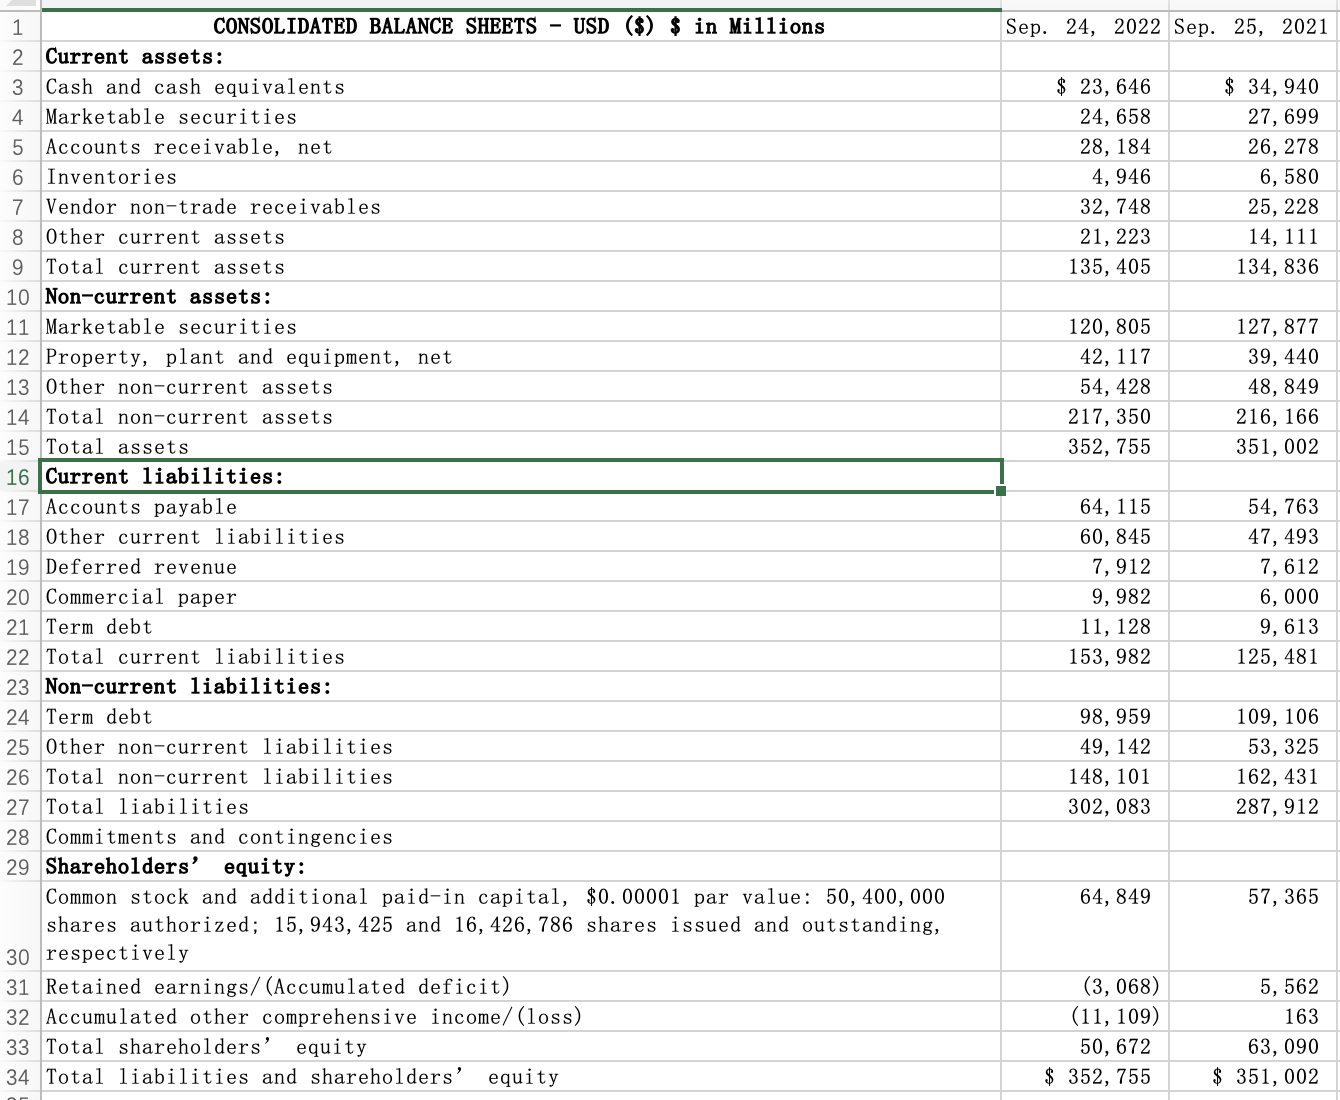
0 Sheet 1: WACC Calculation 0 Equity Value 0 Debt Value (Refer to entry on Sheet 3) 0 Tax Rate (Refer to entry on Sheet 2) 0 Cost of Debt (Refer to entry on Sheet 3) 0 Cost of Equity: Gordon Model (Refer to entry on Sheet 4) 0 Cost of Equity: CAPM (Refer to entry on Sheet 5) O WACC (using Cost of Equity: Gordon Model) 0 WACC (using Cost of Equity: CAPM) O In a note, answer the following question: Do you have a preference between the two methods for calculating Cost of Equity? Explain your answer in either case. 0 Sheet 2: Tax Rate 0 Like we did in class, use at least 3 years of data to estimate an average tax rate. lfyou recall our class work, Apple has had a fairly steady rate so this shouldn't be an issue. 0 Sheet 3: Cost of Debt 0 First estimate Net Financial Debt for year ending 2021 and 2022 (exactly like you did in your EV calculations last week) I Besides the obvious components on the liabilities (CP and Debt), you should also include Other current liabilities and Other noncurrent liabilities for debt here. I Don't include Vendor non-trade receivables here (if you want to know why, read the bottom of the Financial Instruments section of their Notes to Financial Statements), and obviously don't include Deferred revenue here. Both of those should be part of NWC which we're not considering this week. I Don't forget to include both short- and long-term marketable securities as part of excess nancial assets. 0 Estimate the cost of debt as the ratio of net interest expense to net financial debt. 0 Sheet 4: Gordon Model 0 Use the following data: I Total dividends paid in each of the 5 years till Sep 2022 I Net stock repurchase in each of the past 5 years till Sep 2022 I Add two pieces above to get total cash ow to equityholders 0 Estimate the average growth rate in cash flow to equityholders (use arithmetic average) 0 Get the market value at Sep 2022 end 0 Use Gordon model formula to estimate cost of equity 0 Sheet 5: CAPM 0 Beta estimate (Refer to sheet 6) O Risk-free rate (Use the 1-year Treasury bill rate from the Treasury website) 0 Expected market return or Market risk premium (Use the number from class or any other gure you feel is appropriate - with explanation) 0 Sheet 6: Beta Estimate 0 Get 5 years of monthly prices for Apple and VFINX (this will be your market proxy) 0 Calculate the returns 0 Estimate beta 12 Months Ended CONSOLIDATED summms on cownsnsnsns INCOME usn ' u'11' (t) '1" 1 1\" Sep. 24, 2022 Sep. 25, 2021 Sep. 20, 2020 Statement of Comprehensive Income [Abstract] Net income $ 99,803 $ 94,680 $ 57,411 Other comprehensive income/(loss): Change in foreign currency translation, net of tax (1,511) 501 88 Change in unrealized gains/losses on derivative instruments, net of tax: Change in fair value of derivative instruments 3,212 32 79 Adjustment for net (gains)/losses realized and included in net income (1,074) 1,003 (1,264) Total change in unrealized gains/losses on derivative instruments 2,138 1,035 (1,185) Change in unrealized gains/losses on marketable debt securities, net of tax: Change in fair value of marketable debt securities (12,104) (694) 1,202 Adjustment for net (gains)/losses realized and included in net income 205 (273) (63) Total change in unrealized gains/losses on marketable debt securities (11,899) (967) 1,139 Total other comprehensive income/(loss) (11,272) 569 42 Total comprehensive income 1 $ 88,531 $ 95,249 $ 57,453 1 CONSOLIDATED BALANCE SHEETS - USD (3) 3 in Hillions Sep. 24, 2022 Sep. 25, 2021 2 Current assets: 3 Cash and cash equivalents $ 23,646 $ 34,940 4 Marketable securities 24,658 27,699 5 Accounts receivable, net 28,184 26,278 6 Inventories 4,946 6,580 7 Vendor non-trade receivables 32,748 25,228 8 Other current assets 21,223 14,111 9 Total current assets 135,405 134,836 10 Non-current assets: 11 Marketable securities 120,805 127,877 12 Property, plant and equipment, net 42,117 39,440 13 Other nontcurrent assets 54,428 48,849 14 Total nontcurrent assets 217,350 216,166 15 Total assets 352,755 351,002 16 ICurrent liabilities: II 17 Accounts payable 64,115 54,763 18 Other current liabilities 60,845 47,493 19 Deferred revenue 7,912 7,612 20 Commercial paper 9,982 6,000 21 Term debt 11,128 9,613 22 Total current liabilities 153,982 125,481 23 Non-current liabilities: 24 Term debt 98,959 109,106 25 Other non-current liabilities 49,142 53,325 26 Total non-current liabilities 148,101 162,431 27 Total liabilities 302,083 287,912 28 Commitments and contingencies 29 Shareholders' equity: Common stock and additional paid-in capital, $0 00001 par value: 50,400,000 64,849 57,365 shares authorized; 15,943,425 and 16,426,786 shares issued and outstanding 30 respectively 31 Retained earnings/(Accumulated deficit) (3,068) 5,562 32 Accumulated other comprehensive income/(loss) (11,109) 163 33 Total shareholders' equity 50,672 63,090 34 Total liabilities and shareholders' equity $ 352,755 $ 351,002
Step by Step Solution
There are 3 Steps involved in it
1 Expert Approved Answer
Step: 1 Unlock
Question Has Been Solved by an Expert!
Get step-by-step solutions from verified subject matter experts
Step: 2 Unlock
Step: 3 Unlock
Students Have Also Explored These Related Finance Questions!