

Question: bus stats i only need to check my work on B & C pls A statistical program is recommended. A study of emergency service facilities
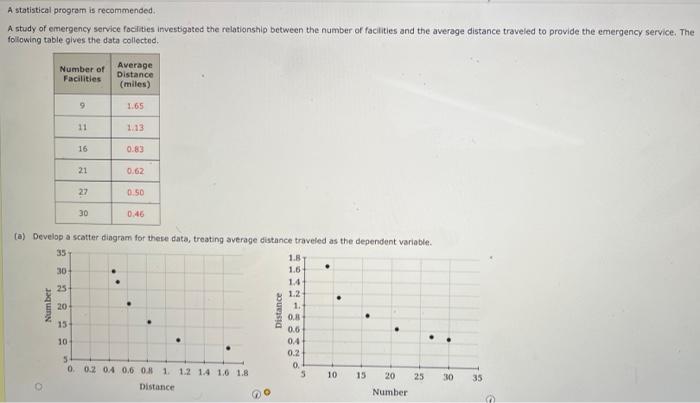
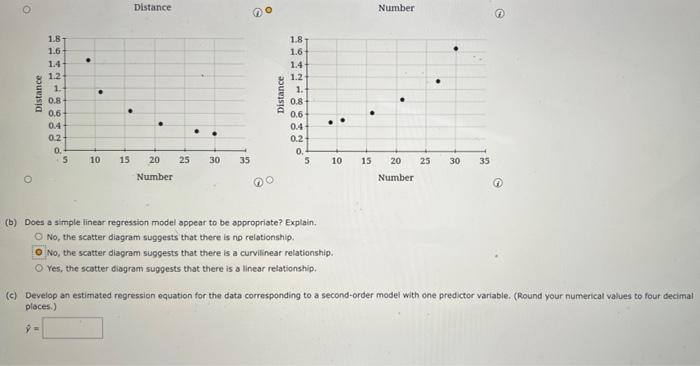
A statistical program is recommended. A study of emergency service facilities investigated the relationship between the number of facilities and the average distance traveled to provide the emergency service. The following table gives the data collected. Number of Average Facilities Distance (miles) 9 1.65 11 1.13 16 0.83 21 0.62 27 0.50 30 0.46 1.6 (a) Develop a scatter diagram for these data, treating average distance traveled as the dependent variable. 35 1.8 30 1.4 25 1.2 20 1. 0.8 15 0.6 10 04 5 0.2 0.02 04 0.6 0.8 1 1.2 1.4 1.6 1.8 0 5 10 15 20 25 Distance Number Number Distance . 30 35 o Distance O Number . . 1.8 1.6 1.4 1.2 1. 0.8 0.6 0.4 0.2 0. 5 1.8 1.6 1.4 1.2 1. 0.8 0.6 0.4 0.2 0. 5 . . . . 10 15 30 35 10 15 30 35 20 25 Number 20 25 Number (b) Does a simple linear regression model appear to be appropriate? Explain. O No, the scatter diagram suggests that there is no relationship. O No, the scatter diagram suggests that there is a curvilinear relationship. Yes, the scatter diagram suggests that there is a linear relationship (c) Develop an estimated regression equation for the data corresponding to a second-order model with one predictor variable. (Round your numerical values to four decimal places.) y =
Step by Step Solution
There are 3 Steps involved in it

Get step-by-step solutions from verified subject matter experts