

Question: BUSI 2 0 4 5 - Assignment 1 Note: Please include both codes, explanations and results in your solutions. ( You may use the Download
BUSI Assignment
Note: Please include both codes, explanations and results in your solutions. You may use the "Download as
or the "Print Preview" function under Menu "File" to generate a PDF report of both codes and results
Question : Data Exploration and Visualization points
Read the dataset income.csv and answer the below questions.
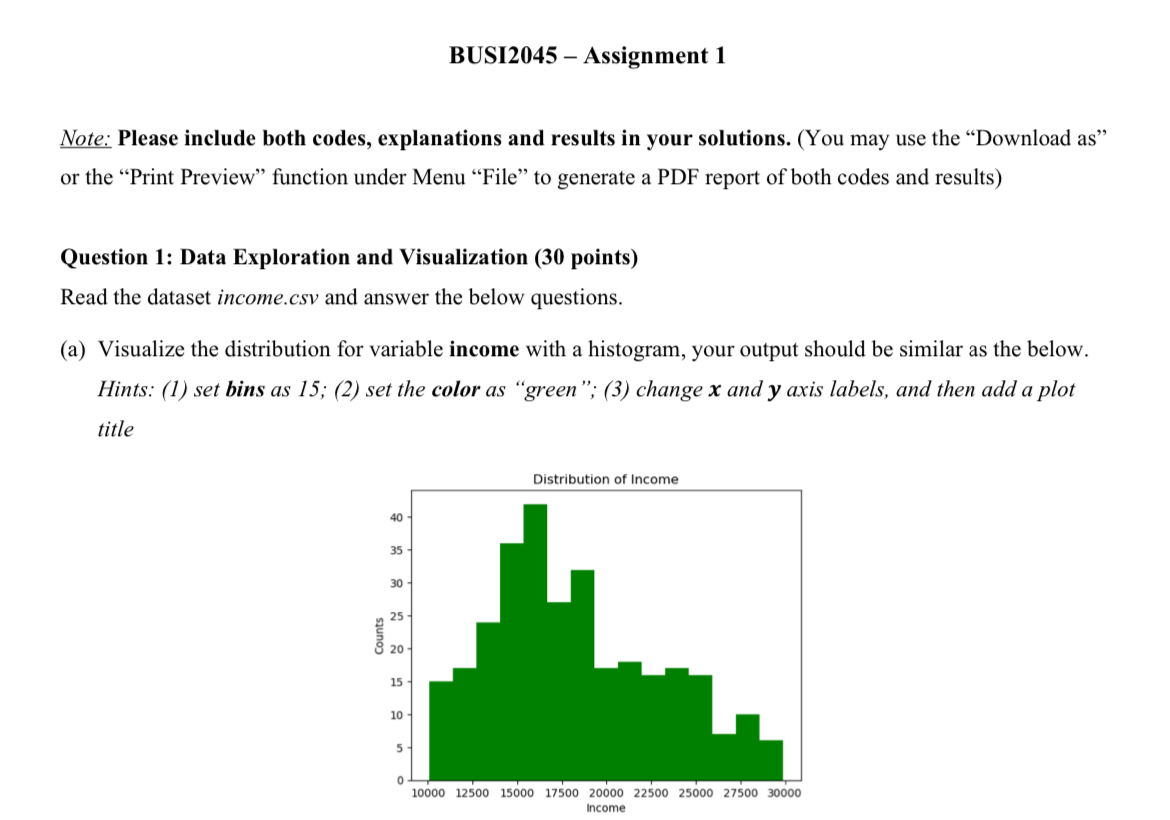
a Visualize the distribution for variable income with a histogram, your output should be similar as the below.
Hints: set bins as ; set the color as "green"; change and axis labels, and then add a plot
title
Step by Step Solution
There are 3 Steps involved in it
1 Expert Approved Answer
Step: 1 Unlock

Question Has Been Solved by an Expert!
Get step-by-step solutions from verified subject matter experts
Step: 2 Unlock
Step: 3 Unlock