

Question: Business analytics final project: Instructions: 1. Take a dataset related to business domain and visualize it using Power BI. 2. Make a report of the
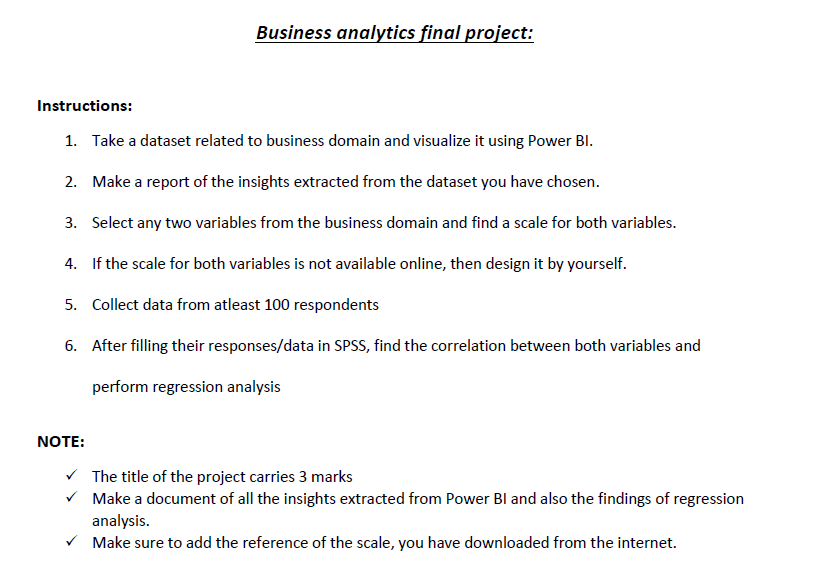
Business analytics final project: Instructions: 1. Take a dataset related to business domain and visualize it using Power BI. 2. Make a report of the insights extracted from the dataset you have chosen. 3. Select any two variables from the business domain and find a scale for both variables. 4. If the scale for both variables is not available online, then design it by yourself. 5. Collect data from atleast 100 respondents 6. After filling their responses/data in SPSS, find the correlation between both variables and perform regression analysis The title of the project carries 3 marks Make a document of all the insights extracted from Power BI and also the findings of regression analysis. Make sure to add the reference of the scale, you have downloaded from the internet. NOTE: Business analytics final project: Instructions: 1. Take a dataset related to business domain and visualize it using Power BI. 2. Make a report of the insights extracted from the dataset you have chosen. 3. Select any two variables from the business domain and find a scale for both variables. 4. If the scale for both variables is not available online, then design it by yourself. 5. Collect data from atleast 100 respondents 6. After filling their responses/data in SPSS, find the correlation between both variables and perform regression analysis The title of the project carries 3 marks Make a document of all the insights extracted from Power BI and also the findings of regression analysis. Make sure to add the reference of the scale, you have downloaded from the internet
Step by Step Solution
There are 3 Steps involved in it

Get step-by-step solutions from verified subject matter experts