

Question: Business data telecommunications & networks :::: With steps please 1. a) Complete the traffic table bade on Figure 3-12 in the book. b) In Figure
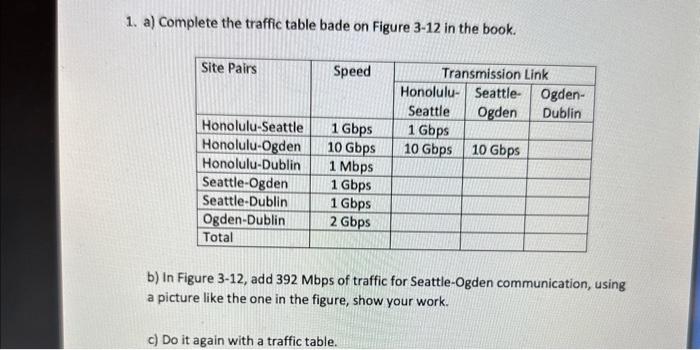
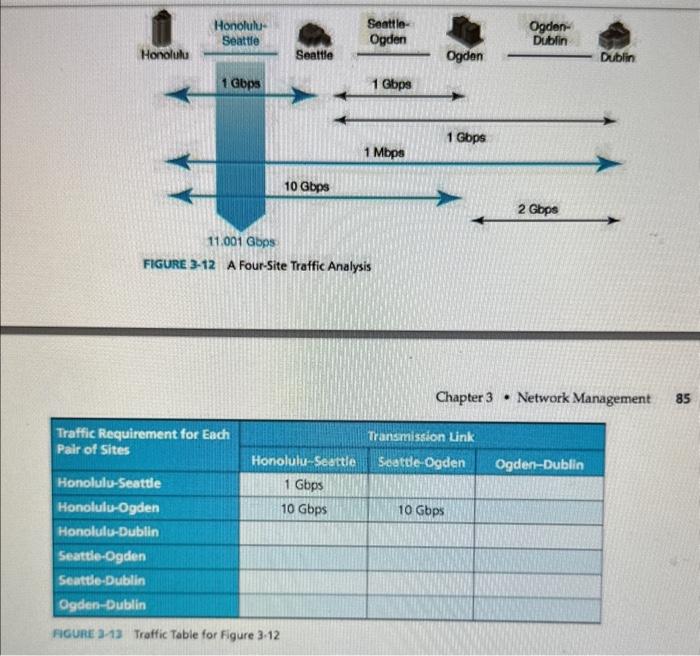
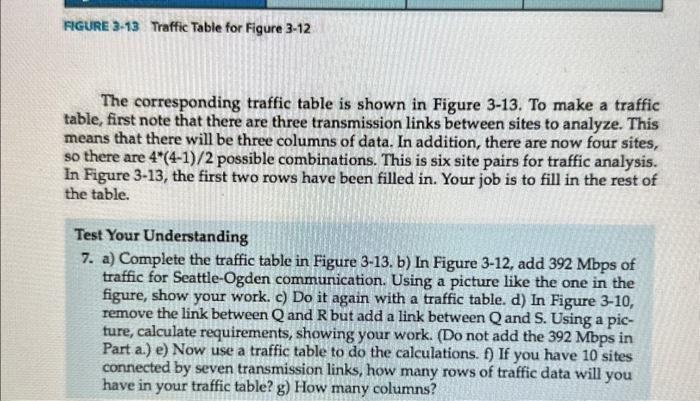
1. a) Complete the traffic table bade on Figure 3-12 in the book. b) In Figure 3-12, add 392 Mbps of traffic for Seattle-Ogden communication, using a picture like the one in the figure, show your work. c) Do it again with a traffic table. Chapter 3 - Network Management If 3-13 Traffic Table for figure 3.12 The corresponding traffic table is shown in Figure 3-13. To make a traffic table, first note that there are three transmission links between sites to analyze. This means that there will be three columns of data. In addition, there are now four sites, so there are 4(41)/2 possible combinations. This is six site pairs for traffic analysis. In Figure 3-13, the first two rows have been filled in. Your job is to fill in the rest of the table. Test Your Understanding 7. a) Complete the traffic table in Figure 3-13. b) In Figure 3-12, add 392 Mbps of traffic for Seattle-Ogden communication. Using a picture like the one in the figure, show your work. c) Do it again with a traffic table. d) In Figure 3-10, remove the link between Q and R but add a link between Q and S. Using a picture, calculate requirements, showing your work. (Do not add the 392Mbps in Part a.) e) Now use a traffic table to do the calculations. f) If you have 10 sites connected by seven transmission links, how many rows of traffic data will you have in your traffic table? g) How many columns
Step by Step Solution
There are 3 Steps involved in it

Get step-by-step solutions from verified subject matter experts