

Question: Business Statistics Quantitative Data Opportunity Construct a frequency distribution with 7 class intervals to describe the monthly employee overtime hours obtained by managers of the
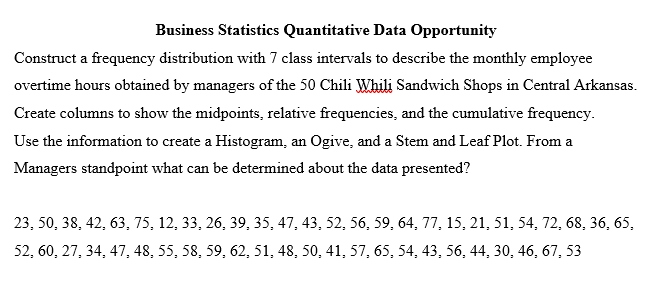
Business Statistics Quantitative Data Opportunity Construct a frequency distribution with 7 class intervals to describe the monthly employee overtime hours obtained by managers of the 50 Chili Whili Sandwich Shops in Central Arkansas. Create columns to show the midpoints, relative frequencies, and the cumulative frequency. Use the information to create a Histogram, an Ogive, and a Stem and Leaf Plot. From a Managers standpoint what can be determined about the data presented? 23, 50, 38, 42, 63, 75, 12, 33, 26, 39, 35, 47,43, 52, 56, 59, 64,77, 15, 21, 51, 54, 72, 68, 36, 65, 52, 60, 27, 34,47, 48, 55, 58, 59, 62, 51, 48, 50, 41, 57, 65, 54, 43, 56, 44, 30, 46, 67, 53
Step by Step Solution
There are 3 Steps involved in it

Get step-by-step solutions from verified subject matter experts